
Menu engineering is the process of using sales data and cost data together to decide what to keep, reprice, redesign, or cut from your menu, so every dish earns its spot based on profit dollars, not gut feeling. Done right, it raises your average contribution margin per plate and cuts food waste within a single quarter. The first move costs nothing: pull an item-level sales report from your POS for the last 30 to 90 days.
That report is the raw material for everything else in this guide. Before you touch a price or rewrite a description, you need to know three things about every item on the menu:
- How many units sold in the period
- What each dish actually costs to plate, including garnish and oil loss
- How that item ranks against others in its own category, not the whole menu
Key Takeaways
Menu engineering raises profit per plate by pairing accurate contribution margin math with a four-quadrant matrix, then testing one change at a time.
| Point | Details |
|---|---|
| Margin beats percentage | Judge items by dollar contribution margin, not food cost percentage, to avoid cutting quiet earners. |
| Cost every plate honestly | Include garnish, oil loss, and modifiers in plate cost, or the whole matrix becomes unreliable. |
| Use the four quadrants | Protect Stars, reprice Plowhorses, spotlight Puzzles, and reconsider Dogs based on category averages. |
| Test one variable at a time | Change price, description, or placement individually and measure over two to four weeks before deciding. |
| Run a 90-day cycle | Do a full re-engineering pass quarterly, with lighter monthly KPI checks in between. |
Table of Contents
- What Is Menu Engineering and Why It Matters to Your Bottom Line
- What Returns and Quick Wins Can You Expect?
- How Do You Run a Menu Engineering Analysis?
- The Four-Quadrant Matrix: Stars, Plowhorses, Puzzles, and Dogs
- Menu Psychology: Placement, Pricing, and Design That Steer Orders
- Turning the Analysis Into an Implementation Plan
- When Does It Make Sense to Bring in a Coach?
- Menu Engineering in Practice: Three Different Dining Rooms
- How Menu Engineering Connects to Inventory and Supplier Relationships
- Analytical Techniques and Tools Beyond the Basic Matrix
- Getting Your Team to Actually Use the Insights
- Bring Menu Engineering Into Your Regular Operating Rhythm
- Where to Go Deeper on Menu Engineering
- What Actually Moves the Needle in Menu Engineering
- Frequently Asked Questions
- Sources
What Is Menu Engineering and Why It Matters to Your Bottom Line
Menu engineering works as a loop, not a one-time project. Sales data flows out of the POS, gets matched against true plate costs, and comes back as a decision: promote it, reprice it, redesign it, or drop it. The EHL Hospitality Business School frames it as an operations-integrated discipline, not an isolated design task, and that framing matters because a menu decision made without kitchen and supplier input usually backfires.
The metric that matters here is contribution margin, the dollar amount left after subtracting plate cost from menu price, not food cost percentage. A dish with a high food cost percentage can still be your best earner if the dollar margin is strong and it sells in volume. A Tableview analysis makes the case plainly: percentage-based thinking leads owners to cut items that are quietly funding the business, while dollar-based thinking protects them.
The payoff for getting this right shows up in three places:
- Profit per cover rises because you're steering guests toward high-margin dishes instead of hoping they land there
- Waste drops because you're producing what actually sells, not what looks good on paper
- Inventory gets simpler because a tighter, better-understood menu means fewer SKUs to track and order
Practitioner guides that track restaurants through a full engineering cycle report revenue improvements in the 10 to 15 percent range when the numbers work are paired with design changes. That's not a guarantee, but it's the kind of return that justifies the two or three hours it takes to run the first report.
What Returns and Quick Wins Can You Expect?
Most operators see gains at two speeds: immediate operational relief and slower revenue lift that compounds over a couple of quarters. The revenue side tends to show up first in items you barely touch, small nudges to price or placement rather than a full menu overhaul.
The operational side often matters more day to day. When you know which dishes actually sell and in what volume, prep lists get shorter and more accurate, walk-in coolers stop filling with ingredients for dishes nobody orders, and your forecast for Friday night stops being a guess based on last Friday's memory.
On the revenue side, the 10 to 15 percent uplift practitioner guides describe usually comes from stacking several small changes rather than one big swing. That distinction is worth sitting with: a kitchen that changes everything at once loses the ability to tell which change actually worked.
Here's where the quick wins tend to live:
- A $1 to $2 price test on a high-popularity, low-margin item, tracked for two to four weeks before judging the result
- A rewritten description on an underperforming dish, adding two or three specific, sensory words instead of a generic label
- Boxing or highlighting a Puzzle item (high margin, low popularity) to see if visibility alone lifts orders
- A mise-en-place adjustment that trims prep time on a Star item so the kitchen can push more volume during a rush
A Stephen Lipinski Consulting template for building a menu-mix report by hand is worth a look if your POS doesn't export clean category data, because the columns you need are the same whether you're using a $30,000 point-of-sale system or a spreadsheet.
Pro Tip: Run the price test on one item at a time. If you move two prices in the same category during the same period, you won't know which change caused the shift in orders.
How Do You Run a Menu Engineering Analysis?
This is the mechanical core of menu engineering, and it's simpler than most owners expect once you know which numbers to pull and in what order.
1. Choose your reporting period. Pick 30 to 90 days of sales data that reflects normal operations, not a holiday week or a period with a broken fryer. Lightspeed's guide recommends this as the first step for a reason: a short or unusual sample skews everything downstream.
2. Export item-level sales from your POS. You need units sold per item, gross sales per item, and ideally modifier data (extra cheese, added protein, swapped sides) broken out separately. Voided or comped orders should be stripped out before you calculate anything, since they inflate popularity numbers without generating real revenue.
3. Cost every dish at the plate level. This step trips up more owners than any other. Plate cost isn't just the invoice price of the protein. It includes the garnish, the sauce, the bread that comes with it, and a reasonable allowance for oil loss, trim waste, and portion drift. Tableview's guidance is blunt about this: sloppy recipe costing produces a matrix that looks authoritative and is quietly wrong, and inaccurate inputs here can throw margin estimates off by 10 to 15 percent, enough to move an item into the wrong quadrant entirely.
4. Calculate contribution margin for every item. The formula is simple:
Contribution Margin = Menu Price − Plate Cost
A burger priced at $18 with a $5.40 plate cost has a $12.60 contribution margin. That number, not the 30 percent food cost ratio, is what should drive your decision about whether to keep, promote, or cut that item.
5. Calculate popularity as a share of category sales. Popularity isn't a menu-wide number, it's category-specific. Compare each burger only against other burgers, each appetizer only against other appetizers. An item that sells fewer units than your top-selling entrée but dominates its own smaller category can still be a Star within that category.
6. Segment and clean the data before you plot anything. Separate dine-in from delivery if your delivery pricing differs, and separate lunch and dinner menus if the same dish carries two different prices depending on daypart. Mixing channels with different price points into one popularity number will distort the whole exercise.
7. Set your category averages. Average contribution margin and average popularity within each category become the midpoints for your matrix axes. Anything above both averages is a Star; below both is a Dog. That's the entire mechanical setup for the next section.
Pro Tip: Keep a separate tab for modifiers. An $18 pasta dish that gets a $4 protein add-on 60 percent of the time has a real average check that's higher than the base menu price suggests, and that changes your margin math.
The Four-Quadrant Matrix: Stars, Plowhorses, Puzzles, and Dogs
Once you've got contribution margin and popularity for every item, plotting them against your category averages sorts the whole menu into four groups. This framework, traced back to Kasavana and Smith's original menu engineering research, remains the standard because it turns a wall of numbers into four clear decisions.
Stars sit above average on both margin and popularity. These are your best-performing dishes, and the instinct to change them is usually wrong. The playbook here is protection: keep the recipe consistent, keep the price roughly where it is, and make sure prep capacity can handle demand during a rush without slipping on quality.
Plowhorses are popular but low-margin. Guests order them constantly, but they're not making you much money per plate. Three moves work here: raise the price in small increments and watch for order drop-off, trim plate cost by adjusting portion size or swapping a cheaper garnish, or pair the dish with a higher-margin add-on at the point of order.
Puzzles are high-margin but low-popularity. The dish makes good money when someone orders it, but not enough people are ordering it. This is where menu psychology earns its keep: better placement, a rewritten description, a photo, or staff upselling can lift visibility without touching the price. Give any change here four to six weeks before judging it.
Dogs are below average on both counts. These items usually need to go, but check two things first: does the dish serve a purpose beyond its own sales (a vegetarian option, a kids' meal), and is it costing you shelf space in the walk-in that a Star could use instead?
A clean way to test any of these moves:
- Change one variable (price, description, or placement) at a time
- Run the test for a fixed period, at least two to four weeks
- Compare the item's new contribution margin and popularity against its pre-test baseline
- Only roll the change into the permanent menu if the metric you targeted actually moved
Practitioner guidance from RestOps backs this one-variable approach specifically: sweeping menu reprints make it nearly impossible to trace which change drove which result.
Menu Psychology: Placement, Pricing, and Design That Steer Orders
The numbers tell you what to change. Menu psychology is how you actually get guests to order the dish you want them ordering, and it's where a lot of the quick wins from earlier get executed.
Placement follows a rough pattern hospitality designers call the golden triangle: the center, then the top right, then the top left of a page draw the most attention first. Whether that exact geometry holds for every layout is debated. Even Wikipedia's summary of menu engineering research notes that eye-tracking studies support the general idea of attention hierarchy but caution that precise "sweet spot" claims vary by menu format and should be tested on your own floor, not assumed from a textbook diagram.
A few placement and pricing moves worth testing directly:
- Put your highest-margin item first in each category, since guests tend to anchor their expectations on whatever they read first
- Drop the dollar sign and use whole numbers where your brand tone allows it. Studies on pricing psychology suggest this reduces the mental friction of spending
- Use charm pricing ($17.90 instead of $18) for value-focused menus, and round pricing ($20 instead of $19.95) for higher-end positioning where guests aren't hunting for a bargain
- Box or shade no more than two or three items per page. Boxing everything cancels the effect entirely
- Add a short, specific description (think "hand-pulled mozzarella" instead of "cheese") to Puzzle items before you touch the price
- Use photos sparingly, ideally on one hero dish per section, since photographing every item can cheapen the perceived value of the whole menu
Digital menus, whether on a tablet, a QR-code page, or a delivery app, give you a real advantage here: you can test a description or price change and see the order data within days instead of waiting for a physical reprint. If you're running a printed menu, batch your changes into a single reprint cycle and use table talkers or a chalkboard for anything you want to test in between.
Pro Tip: Test one design change per cycle, the same discipline as the price tests. A new photo and a new description launched together will move the numbers, but you won't know which one did it.
Turning the Analysis Into an Implementation Plan
A matrix full of Stars and Dogs is useless if nobody owns the follow-through. Here's a seven-step cycle that keeps the work moving without turning into a quarterly fire drill:
- Export item-level sales and modifier data from the POS
- Cost every dish at the plate level, including garnish and prep loss
- Plot items on the four-quadrant matrix using category averages
- Decide on one action per item: protect, reprice, redesign, or cut
- Test one variable at a time, for a fixed window
- Measure the result against the pre-test baseline
- Iterate, folding successful tests into the permanent menu and discarding what didn't move the needle
Four numbers are worth tracking on a running basis, not just at engineering time:
- Contribution margin per item, updated whenever a supplier price shifts
- Category mix percentage, so you catch a slow slide in a category before it shows up in the P&L
- Modifier attach rate, since a high-margin add-on that guests skip is lost profit sitting in plain sight
- Period-over-period change on your Puzzle and Plowhorse items specifically, since those are the ones you're actively working on
Ownership works best split three ways: the general manager owns the report and the cadence, the chef owns costing accuracy and recipe discipline, and front-of-house leadership owns the psychology side, description language, upsell scripts, and placement calls. A workable rhythm is a light monthly check on the four KPIs above, with a full re-engineering cycle, fresh costing, fresh matrix, fresh decisions, every 90 days. That cadence gives price and description tests enough runway to show a real signal before you touch them again.
When Does It Make Sense to Bring in a Coach?
Most of this work is doable in-house with a spreadsheet and a patient GM. Where it stalls is usually POS setup that doesn't cleanly separate modifiers, recipe costing that never gets past guesswork, or a kitchen team that resists a price change because nobody explained the reasoning behind it.
That's the gap Championbusinesscoaching works in with food and beverage clients: wiring up the reporting, building recipe-costing discipline that survives staff turnover, and getting kitchen and floor teams aligned on why a Puzzle item is getting a new description this month. A 90-day engagement lines up naturally with the re-engineering cadence above.
A useful coaching brief covers:
- Current POS reporting gaps (what data you can't currently export cleanly)
- Recipe costing status (documented vs. guessed)
- Staff buy-in history (has a past price change caused pushback?)
Menu Engineering in Practice: Three Different Dining Rooms
A quick-service burger chain running menu engineering typically finds its biggest lever in the Plowhorse quadrant: fries, a house burger, a fountain drink, items that sell in huge volume at thin margins. The usual fix isn't a price hike guests will notice immediately, it's a combo restructure that nudges the average check up through a bundled add-on, tested one region at a time before rolling wider.
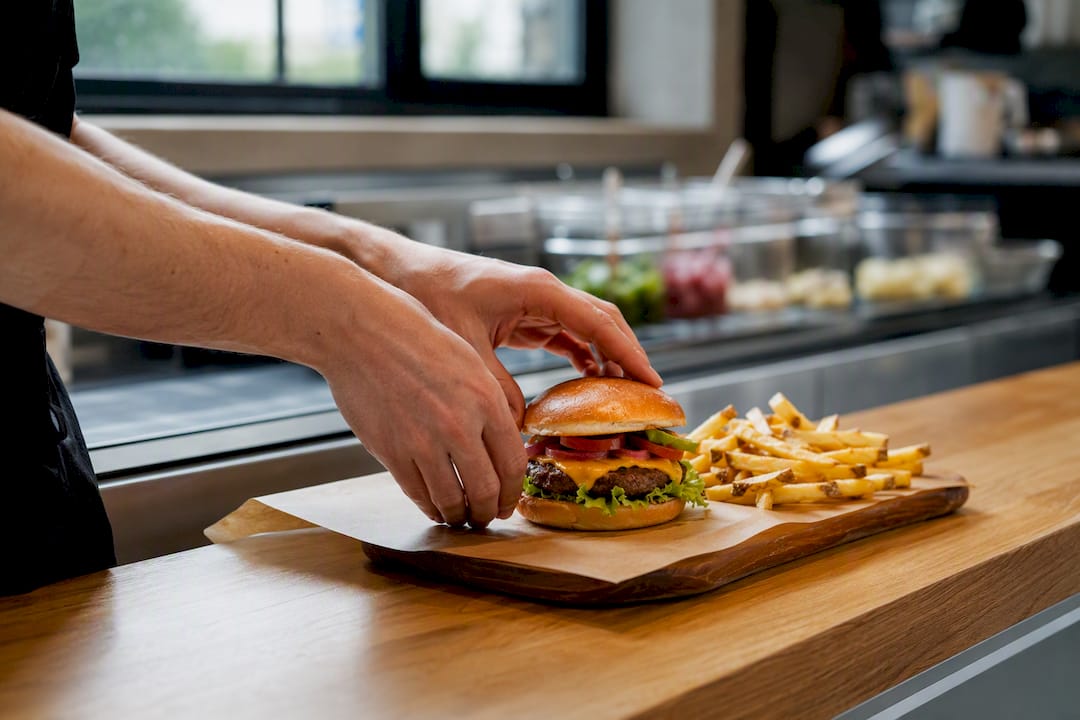
A full-service casual restaurant tends to find more value in the Puzzle quadrant. A braised short rib or a house-made pasta might carry a strong contribution margin but sit buried at the bottom of the entrée list. Moving it up, adding a two-line description, and training servers to mention it by name at the table often lifts orders without a single price change.
Fine dining operates differently again, because volume is naturally lower and each seat carries more weight. Here, the matrix work leans harder on accurate costing, since a single mispriced tasting-menu component can distort the whole category average. A chef-owner who tightens plate costing on shared plates, oil loss, trim, garnish, often finds several dishes were actually Plowhorses masquerading as Stars once the true cost was accounted for.
Across all three formats, the EHL framing of menu engineering as an operations-integrated discipline holds true: the format changes which quadrant needs attention first, but the underlying process, cost accurately, plot honestly, test one variable at a time, stays the same.
How Menu Engineering Connects to Inventory and Supplier Relationships
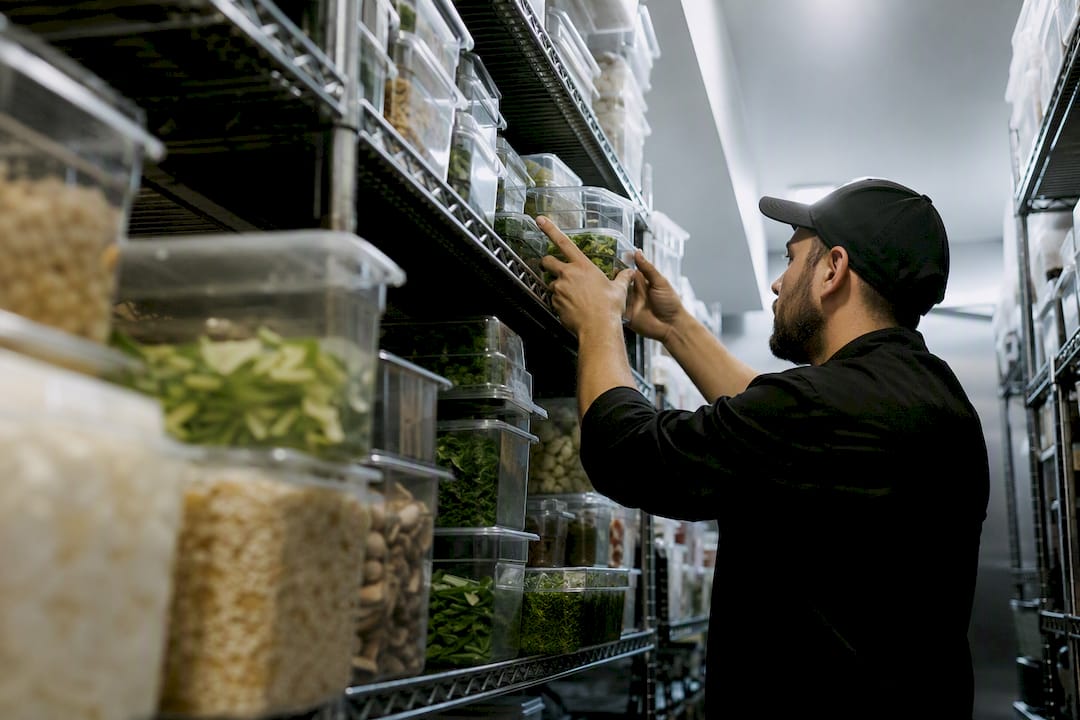
A menu decision made without checking the walk-in is a decision you'll probably reverse. Cutting a Dog item that happens to use up a slow-moving ingredient somewhere else on the menu can leave you with a case of product and no dish to put it in.
Before finalizing quadrant decisions, cross-check each item against your inventory turns. An item you're planning to promote heavily needs a supplier who can handle the volume increase without a price jump or a supply gap during a busy weekend. Conversely, an item you're cutting might free up storage space and simplify your ordering guide, worth factoring into the decision even when the margin numbers alone don't demand a cut.
Supplier conversations work better once you've run the numbers. Walking into a pricing negotiation with a clear picture of which proteins or ingredients drive your Star items gives you leverage to lock in better terms on your highest-volume purchases, and a rationale to drop a supplier relationship tied to a Dog you're removing anyway. A breakeven analysis of your fixed costs against your new contribution margins can also clarify how much volume shift you can absorb before a supplier contract needs renegotiating.
The overlooked piece here is shared ingredients. A garnish or sauce base used across five dishes changes the real cost calculation for all of them if a supplier price moves, which is exactly why plate-level costing needs to be revisited whenever a major supplier contract changes, not just on your quarterly cycle.
Analytical Techniques and Tools Beyond the Basic Matrix
The four-quadrant matrix is the entry point, but a few operators push further once the basics are running smoothly. Trend analysis, tracking an item's contribution margin and popularity across multiple periods rather than a single snapshot, catches a slow decline before it becomes a crisis. An item that's been a reliable Star for two years but has quietly slid toward Plowhorse territory over the last three reporting cycles deserves attention before it fully crosses the line.
Cross-category comparison is another layer worth adding once you trust your base numbers. Comparing your best appetizer margin against your best entrée margin can reveal that an entire category is underpriced relative to guest willingness to pay, a pattern a single-category matrix would never surface.
Most modern POS platforms now include built-in menu-mix or profitability reporting that automates the popularity and margin calculations, cutting the manual spreadsheet work down considerably. For operators without that functionality, Stephen Lipinski Consulting's template approach for building a manual menu-mix report remains a solid fallback, and the column structure it recommends, unit sales, plate cost, contribution margin, category share, translates directly into whatever spreadsheet tool you're already using.
The honest limitation across all of these tools: none of them fix bad input data. A POS report is only as useful as the recipe costing and modifier tracking feeding it, which is why the costing discipline covered earlier matters more than which software you eventually adopt.
Getting Your Team to Actually Use the Insights
A matrix sitting in a manager's inbox changes nothing. The insight has to reach the people taking orders and running the line, and that means translating quadrant labels into plain instructions.
For front-of-house staff, skip the terminology entirely. Instead of explaining that a dish is a "Puzzle," tell servers: "this dish makes us more money per plate than the special, mention it when someone asks what's good tonight." A short pre-shift briefing, two minutes, three items to mention, works better than a laminated matrix nobody reads.
For kitchen staff, the relevant information is different: which items need consistent portioning because they're Stars worth protecting, and which Plowhorse items might see portion or recipe tweaks in the coming weeks. Chefs and line cooks who understand why a recipe is being adjusted, not just that it is, tend to hold the new standard more reliably.
For management, the training that matters most is reading the report itself, understanding that a low popularity number on a high-margin dish is an opportunity rather than a failure, and resisting the urge to make five changes at once instead of testing one. Building this into a recurring 15-minute agenda item at a monthly ops meeting keeps the discipline alive long after the initial excitement of the first analysis fades.
Bring Menu Engineering Into Your Regular Operating Rhythm
If your team needs the recipe costing, POS reporting, and staff training set up correctly the first time, Championbusinesscoaching's business coaching programs are built around exactly that kind of structured, 90-day implementation cycle, backed by a guarantee that if the plan doesn't deliver results, the coaching session is free. For food and beverage operators specifically, that means someone in your corner who has done this costing and testing work before and won't let a messy POS export stall the whole project. You can look at current coaching plans to see what a structured engagement looks like before committing to anything.
Where to Go Deeper on Menu Engineering
For the original quadrant methodology and its academic roots, the Cornell eCommons menu engineering resources are the primary reference. For a practical five-step process and POS reporting checklist, see Lightspeed's operator guide. For a manual spreadsheet template if your POS reporting is limited, Stephen Lipinski Consulting's menu-mix template covers the exact columns to build.
What Actually Moves the Needle in Menu Engineering
The matrix gets most of the attention in this field, but it's the least interesting part. Any manager can plot four quadrants once the data is clean. The real work, and the part most guides skip past, is the costing discipline that comes before it. A Puzzle that's actually a Plowhorse because someone forgot to cost the garnish will send you chasing a placement fix that was never going to work.
The conventional advice to "cut your Dogs" also deserves more skepticism than it usually gets. A low-margin, low-popularity item sometimes exists because it's serving a guest need the matrix doesn't measure, a vegetarian option, a kids' plate, a dish that anchors a family's decision to come back. Cut it blind and you might lose more than the numbers suggest.
If there's one place to start, it's not the matrix. It's an honest recipe cost sheet. Everything downstream, the pricing tests, the description rewrites, the placement decisions, only works if that number is right.
Frequently Asked Questions
What is menu engineering in simple terms? Menu engineering is the practice of using sales data and true dish costs to decide which menu items to promote, reprice, redesign, or remove, based on contribution margin and popularity rather than instinct.
How often should I run a menu engineering analysis? A full cycle, fresh costing and a fresh matrix, works well every 90 days for most restaurants, with lighter monthly checks on contribution margin and category mix in between.
What's the difference between food cost percentage and contribution margin? Food cost percentage measures cost as a share of price, while contribution margin measures the actual dollar amount left after plate cost. A dish can carry a high food cost percentage and still be a strong earner if its dollar margin and volume are high.
Can I do menu engineering without expensive software? Yes. A spreadsheet with unit sales, plate cost, contribution margin, and category share columns covers the core analysis; several practitioner templates, including one from Stephen Lipinski Consulting, walk through the setup.
How many changes should I make to my menu at once? One variable at a time, whether that's price, description, or placement, tested for two to four weeks before deciding whether to keep it, since changing several things together makes it impossible to tell which change worked.
Sources
- Menu engineering: how to make menu decisions that improve profit and operations — EHL
- Cornell eCommons — menu engineering / menu psychology resources
- Menu engineering: how to make a profitable restaurant menu — Lightspeed
- Menu Engineering Guide: Pricing, Design and Margin — Tableview
- Restaurant Menu Engineering: Turn Your Menu Into a Profit Machine — RestOps