
Track a small number of KPIs, typically a handful, not a large set. For most small businesses, that starter set is revenue growth rate, gross profit margin, operating cash flow or cash runway, and either customer acquisition cost or retention rate depending on your model, plus one operational or team metric tied to your biggest current goal. That's the 5 ± 2 rule in practice. Adjust the mix to your business model before you touch a spreadsheet.
TL;DR:
- Focus on five key KPIs that directly align with your current business goal, such as cash flow for survival or revenue growth for scaling.
- Prioritize cash and liquidity metrics like operating cash flow, cash runway, and quick ratio, as liquidity issues cause most small-business failures.
- Assign clear ownership and set SMART targets for each KPI, revisiting them quarterly to adjust for business growth or changing conditions.
- Avoid tracking too many metrics or those without a direct decision hook, and build a routine review process with actionable follow-ups.
- Supplement your core KPIs with sector-specific metrics, but only select two or three to prevent dashboard overload and maintain focus on what moves the needle.
Table of Contents
- KPI Examples for Small Business, Sorted by Category
- How to Pick the Right KPIs for Your Goals and Stage
- Why Cash KPIs Should Top Your Priority List
- KPI Formulas and Quick Worked Examples
- Building a Simple KPI Dashboard and Review Routine
- What Coaching Clients Get Wrong About KPIs
- Common Mistakes to Avoid When Choosing Small Business KPIs
- How to Set KPI Targets You'll Actually Hit
- Industry-Specific KPI Examples Worth Tracking
- What Actually Moves the Needle on KPIs
- Turn Your KPI List Into a 90-Day Action Plan
- Further Reading on KPIs and Small Business Metrics
KPI Examples for Small Business, Sorted by Category
Most owners drown in the wrong metrics before they find the right ones. The fix is grouping candidates by function first, then picking the one or two per category that actually matches your goals. Xero's KPI framework sorts small business performance metrics into four buckets: Efficiency, Growth, Health, and Resilience. That structure alone prevents a dashboard from turning into a wall of noise.
Financial KPIs tell you whether the business is actually making money and can survive a rough month.
- Gross profit margin: revenue minus cost of goods sold, divided by revenue. Tells you if your pricing and production costs are sustainable.
- Net profit margin: net income divided by revenue. Shows what's left after every expense, including rent, salaries, and taxes.
- Operating cash flow: cash generated from core business operations. Often a better real-time health signal than net profit, since profit can look fine on paper while the bank account tells a different story.
- Cash runway: current cash balance divided by average monthly burn. Tells you how many months you can operate if revenue stalled today.
- Current ratio: current assets divided by current liabilities. A quick gut check on whether you can cover short-term obligations.
- Quick ratio: like the current ratio, but strips out inventory. Useful if your stock is slow-moving or hard to liquidate fast.
Growth and marketing KPIs measure whether your customer engine is actually working.
- Revenue growth rate: the percentage change in revenue period over period.
- Customer acquisition cost (CAC): total sales and marketing spend divided by new customers acquired.
- Customer lifetime value (CLV): average revenue per customer multiplied by average customer lifespan.
- Conversion rate: percentage of leads or visitors who become paying customers.
- Average order value: total revenue divided by number of orders. A cheap lever for growth without spending more on acquisition.
Customer KPIs capture whether people who buy from you stick around and like the experience.
- Retention rate: percentage of customers who continue buying over a set period.
- Churn rate: the inverse. The percentage who leave. Even a small drop in churn compounds fast over a year.
- Net Promoter Score or customer satisfaction score: a direct read on whether customers would recommend you, gathered through a short survey.
Operational KPIs flag whether your delivery machine is running efficiently.
- Inventory turnover: cost of goods sold divided by average inventory. Low turnover often means cash is sitting on a shelf.
- Days sales outstanding (DSO): average number of days it takes to collect payment after a sale.
- On-time delivery rate: percentage of orders or jobs completed by the promised date.
- Order processing time: average time from order placement to fulfillment.
HR and team KPIs show whether your people are set up to perform.
- Employee turnover rate: percentage of staff who leave over a given period.
- Revenue per employee: total revenue divided by headcount. A rough proxy for productivity and staffing efficiency.
- Utilization rate: billable or productive hours divided by total available hours, common in service and trade businesses.
How to Pick the Right KPIs for Your Goals and Stage
Don't start with a list of metrics. Start with the specific outcome you're chasing this quarter, then work backward to the one or two indicators that actually move with that outcome.
- Write down your top objective in plain language, like "stop running out of cash by month three" or "get repeat customers to 40% of revenue."
- Map one or two KPIs directly to that objective. If the goal is cash survival, cash runway and operating cash flow do the job. Everything else is secondary this quarter.
- Balance leading indicators (conversion rate, pipeline size) with lagging ones (revenue growth, churn). Leading KPIs warn you early; lagging KPIs confirm what already happened.
- Assign one owner per KPI. A number nobody's accountable for never gets acted on.
- Set a SMART target for each: specific, measurable, achievable, relevant, time-bound. "Improve retention" isn't a target. "Lift 90-day retention from 62% to 70% by Q3" is.
Your stage changes the priority order. Early-stage and survival-mode businesses should watch cash, CAC, and conversion rate above everything else. Businesses with traction shift focus to revenue growth rate and gross margin. Scaling businesses start tracking CLV to CAC ratio and revenue per employee, since headcount efficiency starts to matter more than raw growth.
The most common failure isn't picking the wrong KPI. It's picking too many. A dashboard with twelve metrics and no owners is worse than three metrics somebody actually checks every Monday.
Pro Tip: If a KPI moves and nobody on the team can say what action follows, drop that KPI. A metric with no decision attached to it is just decoration.
Why Cash KPIs Should Top Your Priority List
Low margins are a slow leak. Running out of cash is a sudden stop. That's the core reason liquidity metrics deserve first priority over almost every other small business KPI, even ones that look more impressive on a growth deck.
Operating cash flow tells you whether day-to-day operations generate real cash, separate from accounting profit. Cash runway tells you how many months you can survive at your current burn rate if nothing changes. The quick ratio strips out inventory to show whether you could cover short-term obligations without selling stock you can't move fast.
Cash-flow problems are the most common reason small businesses fail, not underperforming margins. A business can be profitable on paper and still miss payroll because cash arrives late and bills don't wait.
Industry shapes which liquidity metric matters most. A service business with few physical goods can mostly ignore inventory turnover and focus on DSO and operating cash flow instead. A retailer or a business carrying stock needs to watch inventory turnover just as closely as cash, since dead stock ties up money that should be funding operations. Review cash KPIs weekly or biweekly. Everything else can wait for the monthly close.
KPI Formulas and Quick Worked Examples
Formulas only help if you can plug in real numbers fast. Here's the math behind the small business KPI examples covered above, with a quick example for each.
| KPI | Formula | Worked example |
|---|---|---|
| Gross profit margin | (Revenue − COGS) ÷ Revenue | $50,000 revenue, $30,000 COGS → 40% margin |
| Net profit margin | Net income ÷ Revenue | $8,000 net income on $50,000 revenue → 16% margin |
| Operating cash flow | Cash from operations (from cash flow statement) | $12,000 in, $9,000 out on operations → $3,000 |
| Cash runway | Cash balance ÷ average monthly burn | $45,000 cash ÷ $9,000 burn → 5 months |
| Revenue growth rate | (Current period − prior period) ÷ prior period | $60,000 vs. $50,000 last quarter → 20% growth |
| CAC | Total sales/marketing spend ÷ new customers | $4,000 spend, 40 new customers → $100 CAC |
| CLV (simple) | Avg. purchase value × purchase frequency × customer lifespan | $50 × 4 times/year × 3 years → $600 |
| Inventory turnover | COGS ÷ average inventory value | $30,000 COGS ÷ $6,000 avg inventory → 5x turnover |
| DSO | (Accounts receivable ÷ total credit sales) × days in period | $8,000 AR ÷ $40,000 sales × 30 days → 6 days |
Most of these numbers already live in your accounting software, point-of-sale system, or CRM. Pull revenue and COGS from your accounting export, pull acquisition and retention numbers from your CRM, and pull inventory figures from your POS or stock system. You rarely need to build anything new to get the raw data.
Building a Simple KPI Dashboard and Review Routine
A dashboard doesn't need software. It needs a consistent rhythm and a place to write down what you're going to do about each number.
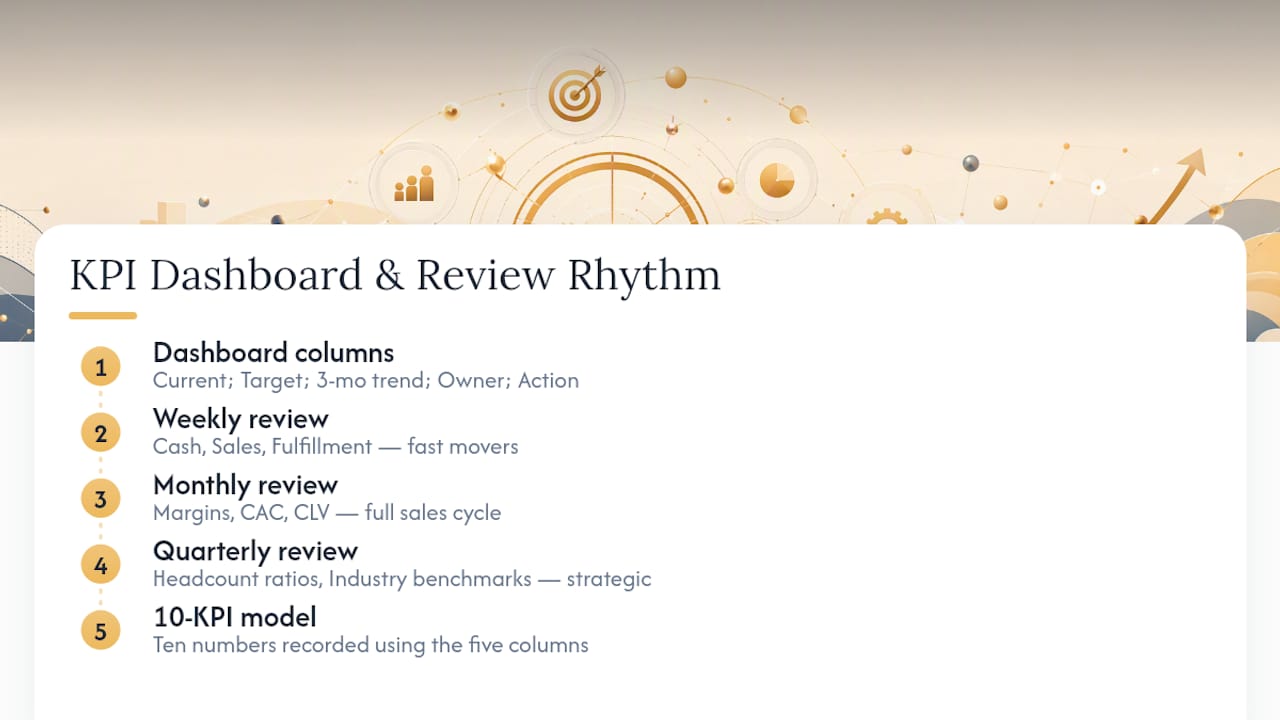
Review cash, sales, and fulfillment metrics weekly, since these move fast and problems compound if you catch them late. Review margins, CAC, and CLV monthly, since these need a full sales cycle to show a real trend. Save strategy KPIs like headcount ratios and industry benchmarks for a quarterly review, where you're stepping back rather than reacting.
A workable dashboard needs five columns: current value, target, trend over the last three months, the owner responsible, and the action required if the number is off track. A ten-number dashboard model built around these columns works for most small operations without added complexity.
You don't need expensive software to start. An accounting export from Xero plus a shared spreadsheet gets you further than most owners expect, and CRM automation can add real-time tracking once your manual system proves the KPIs are worth watching closely.
Pro Tip: End every KPI review meeting with one action item per metric that moved outside its target range. If a review produces zero action items, you're reviewing the wrong numbers.
What Coaching Clients Get Wrong About KPIs
The mistake Duncan sees most often isn't a bad metric choice. It's tracking a number nobody owns and nobody reviews on a schedule. A KPI sitting in a spreadsheet that gets opened once a quarter isn't a performance metric. It's a historical record.
Championbusinesscoaching backs its coaching with a 90-day guarantee: results or your session is free. That guarantee only works because the process starts with picking the right handful of KPIs, not the most impressive-looking ones. Clients also get access to AI-powered tools, including cash flow forecasting and staff management resources, designed to make tracking less of a chore.
Common Mistakes to Avoid When Choosing Small Business KPIs
The biggest mistake is tracking a metric instead of a KPI. A metric is just a number. A KPI is a number tied to a specific strategic target, and the distinction matters because metrics without targets tend to produce analysis paralysis instead of decisions.
The second mistake is volume. Owners often start with a dashboard of fifteen or twenty numbers because each one seems useful in isolation. Nobody reviews twenty numbers consistently, and a KPI that isn't reviewed isn't doing anything.
Other patterns to watch for:
- Copying a competitor's KPI list instead of building one around your own goals and business model.
- Choosing KPIs with no clear owner, so nobody's job depends on the number moving.
- Mixing up vanity metrics (social followers, website visits) with performance metrics that connect to revenue or retention.
- Setting a target with no timeframe attached, which makes "on track" or "off track" impossible to judge.
- Reviewing financial KPIs monthly while ignoring cash KPIs that need weekly attention.
Every one of these mistakes has the same fix: fewer KPIs, clearer ownership, and a target with a deadline attached to it.
How to Set KPI Targets You'll Actually Hit
A target that's plucked out of thin air does more harm than no target at all, because missing an arbitrary number tells you nothing useful about the business.
Start with your own historical data. Where you don't have history yet, benchmark against your industry rather than guessing. A service-based business has very different realistic margins than a retailer carrying physical inventory.
Break annual targets into monthly or quarterly checkpoints so you catch drift early instead of discovering a miss in December. If your goal is 20% revenue growth this year, that's roughly 4 to 5% per quarter, adjusted for seasonality. Attach every target to an owner and a review date, and write down what action happens if the KPI falls short, before it falls short. Deciding the response in advance removes the guesswork when the pressure's actually on.
Revisit targets every quarter. A target set in January might be too easy by June if the business has grown, or too aggressive if conditions changed. Static targets in a fast-moving small business go stale quickly.
Industry-Specific KPI Examples Worth Tracking
The starter set works as a baseline, but your sector adds its own metrics worth layering on top.
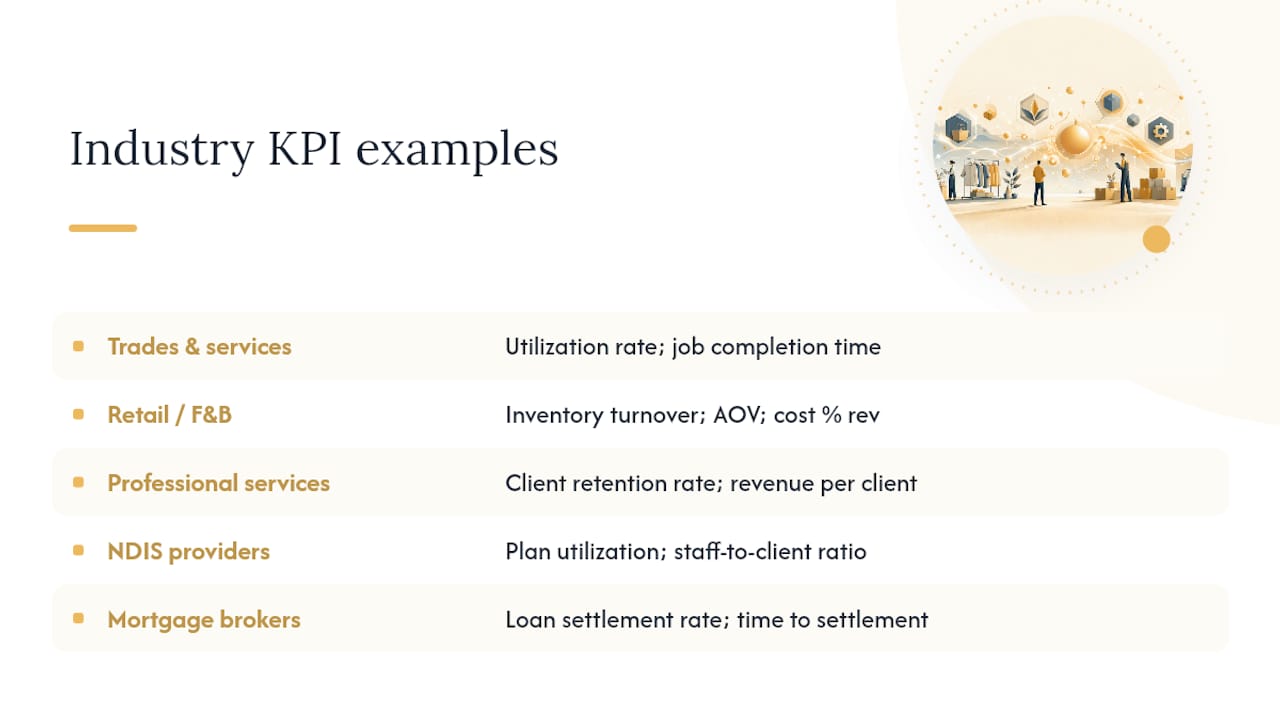
Trades and service businesses should track utilization rate (billable hours against available hours) and job completion time, since profitability lives or dies on how efficiently crews move between jobs.
Retail and food and beverage businesses need inventory turnover and average transaction value front and center, alongside food or stock cost as a percentage of revenue. A café watching food cost percentage catches margin erosion long before it shows up in the monthly profit and loss statement.
Bookkeeping and professional service firms should track client retention rate and revenue per client, since a small roster of high-value, long-term clients usually beats a large roster of one-off engagements.
NDIS providers need to watch service utilization against approved participant plans and staff-to-client ratios, since compliance and capacity constraints shape revenue more directly than in most other sectors.
Mortgage brokers should track loan settlement rate and average time to settlement, since a slow pipeline quietly kills referral relationships even when volume looks healthy on paper.
Videographers and creative freelancers benefit from tracking average project value and repeat client percentage, since one-off gig work rarely builds a sustainable business on its own.
Pick two or three of these on top of your core four to six, not on top of an already crowded dashboard.
What Actually Moves the Needle on KPIs
Most advice on small business KPIs treats every metric as equally important, which is exactly backward. Cash KPIs deserve first attention because a business with weak margins can survive for years, while a business with no cash runway can fail within weeks. That ordering rarely gets stated plainly enough.
The conventional advice to "track everything" is also where most owners waste time. A twenty-line dashboard feels thorough and produces almost no action, while four well-chosen KPIs with clear owners produce a decision every week. The volume of data was never the problem. The follow-through was.
If you take one thing from this, prioritize ownership over sophistication. A basic spreadsheet with a named owner and a weekly check-in beats an elaborate dashboard nobody opens. Build the habit first. Upgrade the tools later, once the habit's actually proven itself.
— Duncan
Turn Your KPI List Into a 90-Day Action Plan
Picking the right KPIs is the easy part. Building a system where someone actually reviews them and acts on what they see is where most small businesses stall out. The process includes a short workshop to lock in your four to six KPIs, a dashboard built around your specific goals, and a 90-day action plan with weekly check-ins to keep the numbers moving.
The process leans on the same strategies that drive measurable growth in coaching engagements across service businesses, trades, and professional firms, backed by a 90-day guarantee: results or your coaching session is free. If cash flow is your first priority, start with the cash flow forecast template to get your runway numbers in order before your first session.
Ready to put a KPI system in place with someone accountable for the results? Book a free consultation and leave with a dashboard and a 90-day plan, not just a list of metrics.
Further Reading on KPIs and Small Business Metrics
- Xero's KPI guide and examples
- NetSuite's financial metrics for small business
- Salesforce's KPI guide for startups