
Map your end-to-end process, find the true bottleneck, and fix that constraint first. That single move delivers faster, more measurable ROI than any other starting point, because adding capacity or technology anywhere else in the workflow leaves the real constraint untouched and cycle time unchanged. Think of it this way: if your approval step takes three days and your execution step takes three hours, automating execution does nothing for your customer's wait time. Fix the approval first.
Here is a quick-action checklist you can start on today:
- Pick one core process (order fulfillment, client onboarding, invoice processing) and draw its steps end to end.
- Measure baseline cycle time: how long does one unit of work take from request to completion, right now?
- Identify where work piles up or waits the longest. That is your bottleneck.
- Pick one targeted fix for that constraint, whether it is a standard operating procedure, a delegation rule, or a simple automation.
- Run a 14-day experiment, measure again, and compare.
Tools like Xero (for financial and operational data) and NetSuite (for enterprise-wide process visibility) can surface the numbers you need to find that bottleneck fast. Championbusinesscoaching works with Australian businesses to embed exactly this kind of structured, measurable approach from day one.
Table of Contents
- What is operational efficiency, and how does it differ from effectiveness?
- Why operational efficiency matters for Australian businesses
- What are the practical steps to improve operational efficiency?
- How do you measure operational efficiency with the right KPIs?
- Which technology options actually accelerate efficiency?
- How do you build the people and governance structures that make gains stick?
- What does an implementation roadmap actually look like?
- A real-world example of efficiency coaching in action
- Key Takeaways
- The mistake most businesses make when chasing efficiency
- Championbusinesscoaching helps you build efficiency that lasts
- Useful sources for further reading
What is operational efficiency, and how does it differ from effectiveness?
Operational efficiency is the ratio of useful output to input. Output includes revenue, completed transactions, and customer satisfaction. Input covers time, labor, cost, and capital. When you get more output from the same input, or the same output from less input, efficiency improves. The operational efficiency ratio is sometimes expressed as (operating expenses + cost of goods sold) divided by net sales, where a lower number signals better performance.
Three concepts get confused constantly, and the confusion costs businesses real money:
- Operational efficiency: doing things right. Reducing waste, cycle time, and cost per transaction.
- Operational effectiveness: doing the right things. Choosing the activities that actually serve your strategy.
- Operational excellence: a sustained cultural shift where continuous improvement is embedded in how everyone works, not just a set of one-off projects.
A business can be highly efficient at the wrong work. Imagine a trades company that processes supplier invoices in under 24 hours, with a first-pass yield above 95%, but those invoices are for materials on projects with negative margins. The process is tight; the strategy is broken. Efficiency without effectiveness is just a faster way to lose money.
Operational excellence is not the destination of an efficiency project. It is the culture that makes efficiency gains permanent. Treat your efficiency initiatives as the building blocks of that culture, not as the finish line.
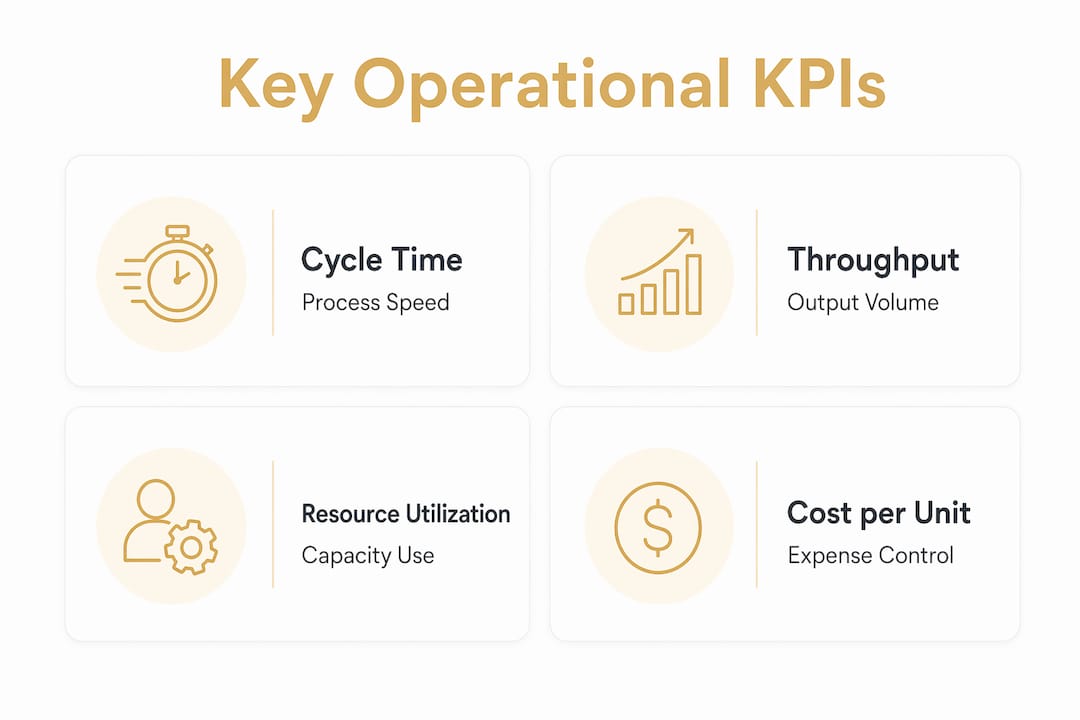
Process-specific KPIs that measure these concepts include cycle time (total elapsed time from request to completion, including wait time), first-pass yield (the percentage of work completed correctly without rework), and throughput (units of work completed per unit of time). These three metrics together give you a clear picture of where a process stands.
Why operational efficiency matters for Australian businesses
Australia's labor costs rank among the highest in the Asia-Pacific region, which means waste in people's time hits the bottom line harder here than in many comparable markets. A process that wastes two hours per employee per day across a ten-person team costs roughly 100 hours of productive capacity every week. At Australian award wage rates, that adds up quickly.

The link between efficiency and brand growth is also direct: businesses that deliver consistently and quickly build reputations that attract better clients and justify premium pricing. Efficiency is not just a cost story; it is a revenue story.
Quick wins typically pay back within a few weeks to a few months. Larger transformation programs, such as ERP implementations or end-to-end process redesigns, usually take several months to show full returns. The payback window matters for prioritization: if cashflow is tight, start with the fixes that return value fastest.
Key benefits Australian businesses report from structured efficiency work:
- Lower cost per transaction, which directly improves gross margin.
- Faster turnaround times, which reduce customer churn and improve Net Promoter Score.
- Greater resilience when staff are absent, because documented processes reduce single-person dependency.
- Improved compliance posture, since standardized workflows create audit trails automatically.
The one trap worth naming early: efficiency without strategic alignment produces faster execution of the wrong work. Before you optimize any process, confirm it serves a goal that actually matters to your business.
What are the practical steps to improve operational efficiency?
Follow this sequence. Each step builds on the last, and skipping ahead, particularly to automation, before completing the earlier steps is one of the most common and expensive mistakes.
-
Map the process end to end. Document every step from the initial request to the final output. Include handoffs, approvals, and wait times. Process mapping reveals waiting, rework, duplicate data entry, unclear ownership, and approval bottlenecks that are invisible until you draw them out.
-
Measure baseline performance. Record cycle time, first-pass yield, and error rate for the current state. Without a baseline, you cannot prove that any change worked.
-
Find and fix the true bottleneck. The bottleneck is the step where work accumulates fastest. Adding capacity to a non-bottleneck increases idle time elsewhere and does not reduce total cycle time. Fix the constraint first, then reassess.
-
Set standard work and SLAs. Document the agreed best method for each step. Assign clear ownership. Set service-level agreements so everyone knows what "done on time" means.
-
Apply targeted automation. Automate only steps that are already well-understood and consistently executed. Automation that runs on top of a broken process just produces errors faster.
-
Train and cross-train your team. Skill gaps and single-person dependencies are hidden bottlenecks. Cross-training reduces risk and keeps throughput stable when people are unavailable.
-
Monitor, review, and iterate. Efficiency is not a one-time project. Set a review cadence, track KPIs, and run improvement cycles continuously.
Quick wins you can act on this week
| Initiative | Expected outcome | Timeframe |
|---|---|---|
| Eliminate one approval layer with a delegation rule | Cycle time drops by the average approval wait | 1–3 days |
| Create a one-page SOP for your highest-volume task | Error rate and rework fall immediately | 3–5 days |
| Set up automated invoice reminders in Xero | Debtor days reduce without manual follow-up | 1 day |
Lean tools and when to use them
The 5S method (Sort, Set in order, Shine, Standardize, Sustain) is a fast way to eliminate physical or digital clutter that slows work. Standard work documentation is the next step: write down the agreed best method and make it the default. These Lean quick tools work well for most small-to-medium Australian businesses without requiring specialist training.
Six Sigma methods (DMAIC: Define, Measure, Analyze, Improve, Control) are worth bringing in when a problem is statistically complex, when defect rates need to reach near-zero, or when you are dealing with high-volume, high-consequence processes like healthcare or manufacturing. For most service businesses, Lean tools get you 80% of the way there at a fraction of the effort.
Pro Tip: Use an impact-versus-effort matrix before committing to any initiative. List your candidate improvements, score each on potential impact (1–5) and implementation effort (1–5), and prioritize the high-impact, low-effort items first. That is where your quick wins live. For a practical prioritization framework, the prioritization approach outlined here is worth reviewing before you build your initiative list.
How do you measure operational efficiency with the right KPIs?
Measurement is where most businesses stall. They either track too many metrics and drown in data, or they track the wrong ones and optimize for something that does not move the needle on profit or customer experience.

| KPI | What it measures | Calculation | When to use it |
|---|---|---|---|
| Cycle time | Total elapsed time, request to completion | End timestamp minus start timestamp | Any process with a defined start and end |
| Throughput | Volume of work completed per period | Units completed ÷ time period | Capacity planning and bottleneck detection |
| Cost per transaction | Fully loaded cost of one unit of work | Total process cost ÷ number of transactions | Pricing, margin analysis, automation ROI |
| First-pass yield | Work completed correctly without rework | Correct units ÷ total units processed | Quality improvement and training needs |
| Error rate | Frequency of defects or mistakes | Errors ÷ total outputs | Compliance, customer experience |
| On-time completion | Percentage of work finished by the agreed deadline | On-time completions ÷ total completions | SLA management and customer satisfaction |
| Labor utilization | Proportion of available time spent on productive work | Productive hours ÷ available hours | Staffing and scheduling decisions |
These KPIs cover both the input side (labor utilization, cost per transaction) and the output side (first-pass yield, on-time completion), which is exactly the balance you need. Measuring only inputs, like unit production cost or hours worked, tells you what you spent but not what you got for it.
Benchmarking tips:
- Set your baseline from at least four weeks of real data before making any changes.
- Segment by team, product line, or region. An average that looks acceptable often hides one segment that is performing well and another that is failing.
- Use percentile trends over time rather than point-in-time snapshots. A metric moving from the 40th to the 70th percentile of your own historical data is a real signal of improvement.
- Link every KPI back to a business outcome. Cycle time matters because it affects customer satisfaction and cashflow. First-pass yield matters because rework costs labor and delays revenue.
Pro Tip: The most dangerous KPI trap is optimizing a metric that is easy to measure but disconnected from outcomes. Tracking "emails sent" instead of "deals closed" is the classic version. Before you add a KPI to your dashboard, write one sentence explaining how improving it will show up in profit, cashflow, or Net Promoter Score. If you cannot write that sentence, drop the metric.
Which technology options actually accelerate efficiency?
Technology accelerates a well-designed process. It does not fix a broken one. Automation built on top of a poorly understood process produces errors at scale and makes them harder to trace. That warning applies to every category below.
The main tool categories and what they solve:
- Workflow automation and RPA (Robotic Process Automation): Handles repetitive, rule-based tasks like data entry, invoice matching, and report generation. Reduces manual error and frees staff for higher-value work.
- ERP (Enterprise Resource Planning): Integrates finance, operations, inventory, and HR into one data layer. NetSuite is a widely used enterprise-class platform that gives management real-time visibility across the whole business. For smaller Australian businesses, Xero provides financial and operational data in a format that connects to most workflow tools.
- IWMS (Integrated Workplace Management Systems): Manages facilities, space, and maintenance. Relevant for businesses with physical assets or multiple sites.
- Process mapping and analytics tools: Platforms like Lucidchart or Miro for mapping, and Power BI or Tableau for analytics, help you visualize where work slows down.
- Energy management software: Tracks and reduces energy consumption, which is a meaningful cost lever for manufacturing and hospitality businesses in Australia.
- Predictive maintenance tools: Use sensor data and AI to flag equipment issues before they cause downtime. IBM's guidance on ERP, IWMS, and predictive maintenance reflects how these categories work together in larger organizations.
How to select and pilot a tool without wasting money
- Define the specific process problem the tool must solve before you look at vendors.
- Check integration: does it connect to your existing systems (Xero, your CRM, your project management tool)?
- Confirm data ownership: you must be able to export your data if you leave.
- Assess local support: Australian business hours matter when something breaks.
- Demand a measurable ROI estimate before committing, and agree on how you will measure it.
- Run a time-boxed pilot of 30–60 days with a small team before full rollout.
Pro Tip: Define your pilot's success criteria before you start, not after. Write down: "This pilot succeeds if cycle time for [process] drops by [X]% within [Y] days." Set a go/no-go date. If the criteria are not met, roll back and reassess rather than expanding a tool that is not working. This governance step is the one most businesses skip, and it is the reason so many technology investments underdeliver.
How do you build the people and governance structures that make gains stick?
Process improvements fail when accountability is unclear. The most common pattern: a team runs a successful pilot, the process improves, and then six months later the old habits are back because no one owned the new method.
Role design using a RACI framework:
| Role | Responsible | Accountable | Consulted | Informed |
|---|---|---|---|---|
| Process design | Operations lead | Business owner | Front-line staff, IT | All staff |
| KPI measurement | Operations analyst | Operations lead | Finance | Management team |
| Exception escalation | Team lead | Operations lead | Relevant department head | Business owner |
| Continuous improvement | Operations lead | Business owner | All departments | Board/advisors |
Training and cross-training touchpoints:
- Onboarding: every new hire learns the documented standard work for their role before they adapt it.
- Quarterly refreshers: review SOPs when processes change, not just annually.
- Cross-training: identify every task that only one person can do and train a backup. Single-person dependencies are operational risk.
Governance checklist:
- Weekly or fortnightly KPI review meeting (15 minutes, data on screen, no slide decks).
- Monthly SLA review against agreed targets.
- Quarterly process audit: are the documented methods still the actual methods?
- Annual strategic alignment check: are the processes you are optimizing still the right ones?
Pro Tip: Tie performance reviews to process KPIs, but build in a gaming safeguard. If a team member's bonus depends on first-pass yield, they will find ways to reclassify errors rather than eliminate them. Pair every KPI incentive with a second metric that catches gaming: pair first-pass yield with customer complaint rate, or pair throughput with error rate. The combination is much harder to game than either metric alone.
Coaching that embeds repeatable review cycles and measurement discipline is consistently more effective at sustaining gains than one-off consulting engagements. The difference is accountability over time, not just advice at a point in time. For a deeper look at how coaching drives operational discipline, the approach matters as much as the tools.
What does an implementation roadmap actually look like?
| Phase | Focus | Expected outcomes | Typical timeframe |
|---|---|---|---|
| Quick wins | Map one process, fix the bottleneck, set one SOP | Cycle time reduction, visible quick improvement | 0–14 days |
| 90-day sprint | Baseline all core processes, pilot one automation, embed KPI reviews | Measurable efficiency gains across 2–3 processes | Days 15–90 |
| 6 month scaling | ERP or integration rollout, cross-training program, governance embedded | Sustained margin improvement, reduced operational risk | Months 3–6 |
Cost and resource ranges (indicative, in AUD):
- Small process fixes (SOP writing, delegation rules, basic automation in Xero): $0–$5,000, mostly internal time.
- Automation pilot (RPA tool, workflow software): costs vary depending on tool and scope.
- ERP or integration project (NetSuite or equivalent): cost varies widely depending on business size and complexity.
- External coaching or fractional operations support: varies by provider and program length.
Resource planning notes:
- Quick wins require one internal champion with 3–5 hours per week.
- The 90-day sprint needs a dedicated operations lead or an external coach to keep momentum.
- Scaling phases typically require either a full-time operations manager or a fractional/coach arrangement until the business can justify the hire.
When to bring in external help: if your team has identified the bottleneck but lacks the method to fix it, or if previous improvement efforts stalled after the initial enthusiasm, that is the signal to bring in a coach or specialist. Australian business improvement approaches that combine internal ownership with external accountability consistently outperform either approach alone.
Package your 90-day sprint as a formal experiment: write down the hypothesis ("If we fix the approval bottleneck in our onboarding process, client activation time will drop from 14 days to 7 days within 90 days"), set a go/no-go gate at day 60, and review results at day 90 before committing to the next phase.
A real-world example of efficiency coaching in action
A service-based business in Australia was struggling with a client onboarding process that took an average of 18 days from signed contract to first delivery. Staff were busy, but the work kept stacking up at the same two points: document collection and internal approval.
The intervention followed three steps:
- Process map: The full onboarding workflow was drawn out, revealing that 11 of the 18 days were pure wait time, not active work.
- Bottleneck fix: A document checklist was sent to clients at contract signing (eliminating back-and-forth), and approval authority was delegated to the team lead for standard cases.
- Automation and training: Automated reminders were set up in the CRM for outstanding documents, and the team lead was trained on the new approval criteria.
Within 60 days, average onboarding time dropped to 9 days, a reduction of 50%. Cost per onboarded client fell as staff time on the process dropped by roughly a third. The business owner reported that the improvement freed up capacity equivalent to one part-time role, which was redirected to business development.
The fastest efficiency gains almost always come from removing wait time, not from working faster. In most service businesses, active work time is a fraction of total cycle time. The rest is waiting: for approvals, for information, for someone to pick up the task. Fix the wait, and the numbers move immediately.
What made this approach repeatable:
- The process map became a living document, reviewed quarterly.
- KPIs (cycle time, first-pass yield, cost per client) were added to the monthly management review.
- The team lead's role was formally updated to include process ownership.
Championbusinesscoaching structures its engagements around exactly this method: one-on-one coaching sessions, AI-enabled business tools (including a position description generator and staff management resources), and a 90-day guarantee. If you do not see measurable results within 90 days, the coaching session is free. For service-based businesses in particular, this structured approach closes the gap between knowing what to fix and actually fixing it.
Key Takeaways
Achieving operational efficiency requires mapping your process, fixing the true bottleneck first, measuring with the right KPIs, and embedding governance so gains do not erode over time.
| Point | Details |
|---|---|
| Start with the bottleneck | Map end-to-end before fixing anything; adding capacity to a non-constraint wastes money. |
| Measure both sides | Track input KPIs (cost, labor) and output KPIs (first-pass yield, on-time completion) together. |
| Automate last, not first | Automation on a broken process produces errors faster; fix the process design first. |
| Embed governance | Assign clear RACI ownership and a weekly KPI review or gains will revert within months. |
| Phase your roadmap | Quick wins in 0–14 days, a 90-day sprint for core processes, scaling at 6 months. |
| Championbusinesscoaching | Offers a 90-day coaching guarantee and AI-enabled tools to help Australian businesses embed measurable efficiency gains. |
The mistake most businesses make when chasing efficiency
Most businesses approach efficiency the wrong way. They see a problem, they buy a tool, and they wonder why nothing changed. The tool was not the problem. The process was the problem, and the tool just made it more expensive.
The mindset shift that actually works is this: treat every efficiency initiative as a hypothesis, not a solution. "We believe that if we fix X, outcome Y will improve by Z within N days." That framing forces you to define success before you start, which is the only way to know whether you succeeded.
Three mistakes I see repeatedly in coaching engagements:
First, skipping the map. Business owners know their processes intuitively, so they skip the documentation step. But intuition misses the handoffs, the wait times, and the workarounds that staff have quietly built around broken steps. The map reveals what intuition hides.
Second, automating before standardizing. A team automates a process that has three different versions depending on who is doing it that day. The automation picks one version and runs it at scale. The other two versions still happen manually, now alongside the automated one. Standardize first, then automate.
Third, measuring activity instead of outcomes. Tracking how many tasks were completed is not the same as tracking whether the right work got done well. Activity metrics feel productive. Outcome metrics tell the truth.
The question of when to bring in external coaching is simpler than most people think: if your team has tried to fix the same problem twice and it came back, you need outside accountability. Internal teams have internal politics. A coach does not.
Championbusinesscoaching helps you build efficiency that lasts
Knowing what to fix is one thing. Having the structure, accountability, and tools to actually fix it, and keep it fixed, is another. Championbusinesscoaching works with Australian business owners and managers to do exactly that: map the real constraints, build the measurement systems, and embed the governance that makes improvements permanent.
The coaching model is deliberately focused. Slots are limited to protect quality, and every engagement comes with a 90-day guarantee: measurable results or your coaching session is free. That is not a marketing line; it is the accountability structure that keeps the work honest. Services cover one-on-one and team coaching, a structured 90-day sprint program, and access to AI-powered business tools including cash flow forecasting, a customer avatar builder, and staff management resources.
If you are a service business, a trades operator, or a growing enterprise looking to get more from your existing team without burning them out, the coaching programs are built for that exact situation. The next step is straightforward: book a free consultation and walk through your biggest operational constraint with a coach who has seen it before.
Useful sources for further reading
These resources are worth bookmarking if you want to go deeper on any of the frameworks covered above.
- What Is Operational Efficiency? | IBM: IBM's overview of ERP, IWMS, predictive maintenance, and automation as efficiency levers. Useful for technology selection and understanding how enterprise tools connect.
- Operational Efficiency 101 | Moxo: Practical breakdown of process mapping, bottleneck analysis, and KPI definitions including cycle time and first-pass yield. One of the cleaner practitioner-level resources available.
- What Is Operational Efficiency? | NetSuite: Covers the operational efficiency ratio and financial measurement approaches. Useful for finance-focused readers and those evaluating ERP platforms.
- 17 Steps to Improve Operational Efficiency | NetSuite: A detailed step list with cross-functional guidance. Good for building an initiative backlog and governance checklist.
- Business Efficiency vs Effectiveness | NetSuite: Clarifies the distinction between efficiency and effectiveness with practical examples. Read this before you start any improvement program.
- Operational Excellence vs Efficiency | Aztech Training: Explains why operational excellence is a culture shift, not just a project outcome. Useful context for leaders building long-term programs.
- How to Improve Operational Efficiency | Coursera: Accessible overview of automation, training, and energy management as efficiency levers. Good starting point for teams new to the topic.
- Australian Treasury: Productivity and Business Investment: Australian government analysis of productivity drivers relevant to local business context. Worth reading for the macroeconomic framing around labor costs and digital investment in Australia.