Food cost percentage is the share of your food sales eaten up by ingredient cost, calculated as cost per serving divided by menu price, times 100. Most full-service restaurants should land somewhere between 28% and 35%, though quick-service concepts run leaner and fine dining often sits higher. Where you fall inside that range depends on your concept, your supplier contracts, and how tightly you run portion control.
TL;DR:
- Regularly compare ingredient costs to menu prices to ensure dishes are priced within the ideal 28-35% food cost range for your concept.
- Use the per-dish formula for menu pricing and the period COGS for overall operational performance to detect waste and spoilage issues.
- Track actual inventory, purchases, and food sales weekly, excluding staff meals and giveaways, to maintain accurate food cost data.
- Focus on controlling waste, standardizing recipes, and consolidating purchases to lower food cost percentage without sacrificing quality.
- Implement a consistent weekly review process and consider coaching support to improve discipline and proactively manage prime costs.
Table of Contents
- How to Calculate Food Cost Percentage the Right Way
- Worked Examples: From Recipe Cost to Menu Price
- What Is a Good Food Cost Percentage for Your Concept?
- Cutting Food Cost Without Cutting Corners
- Building Food Cost Into Your Budget and Prime Cost
- The Tools and Weekly Habits That Keep Food Cost Honest
- Why Most Restaurants Get Food Cost Wrong
- Get Hands-On Help Lowering Prime Cost
- Sources
How to Calculate Food Cost Percentage the Right Way
There are two calculations you need, and they answer different questions. One tells you whether a single dish is priced correctly. The other tells you whether your whole kitchen is bleeding money over a week or a month. Confusing the two is one of the most common mistakes owners make.
The per-dish formula answers "is this menu item priced right?" You need the total ingredient cost for one plated serving and the menu price you're charging for it:
Food cost % = (Cost per serving ÷ Menu price) × 100
If a burger costs $4.20 in ingredients and sells for $16, that's 26.25%. Simple, fast, and useful for pricing decisions in real time.
The period COGS formula answers "how is the whole operation actually performing?" This is the one that shows up on your profit and loss statement, and it's the number your accountant and your bank actually care about:
Food cost % = (Opening inventory + Purchases − Closing inventory) ÷ Food sales × 100
This version captures theft, waste, spoilage, and portioning drift that a per-dish calculation never sees. A dish can be perfectly costed on paper and still lose money if your walk-in cooler is bleeding product through spoilage or your line cooks are eyeballing portions instead of weighing them.
A few calculation pitfalls trip up even experienced operators:
- Forgetting to exclude staff meals, comps, and promotional giveaways from food sales while still counting their ingredient cost, which artificially inflates the percentage
- Failing to adjust for inter-location transfers if you run multiple sites and shift stock between them
- Using outdated invoice prices instead of the actual cost paid that period, especially when produce prices swing week to week
- Counting beverage or retail inventory inside food cost instead of tracking it separately
- Skipping a physical inventory count and estimating closing stock, which introduces error that compounds month over month
Use the per-dish formula when you're building or revising a menu. Use the period formula every week or month to check whether your kitchen is actually delivering the margins your menu promises on paper. The free calculators available online apply both formulas automatically once you enter ingredient and inventory data, which is worth using if you're doing this by hand for the first time.
Worked Examples: From Recipe Cost to Menu Price
Numbers make this concrete. Here's how a per-dish calculation and a period calculation actually play out.
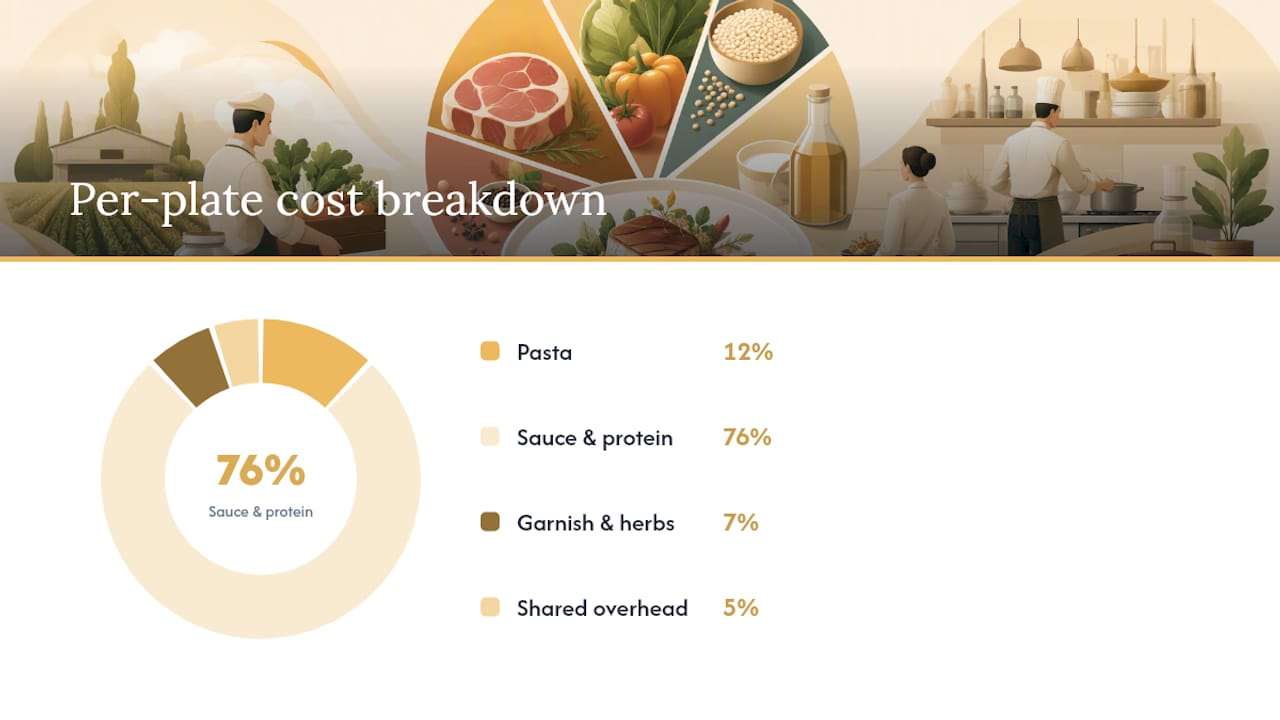
Per-plate example. Say you're costing a pasta dish. The ingredients: 150g of pasta ($0.60), 200g of sauce and protein ($3.80), garnish and herbs ($0.35), and a portion of shared overhead for oil and seasoning ($0.25). Total plate cost: $5.00.
- Add up every ingredient at the exact quantity used in the standardized recipe. Total cost per serving: $5.00.
- Divide by your target food cost percentage, say 30%, using the factor method: menu price = $5.00 ÷ 0.30 = $16.67.
- Round to a psychologically clean price point. $16.90 or $16.95 both preserve the target margin while looking intentional rather than arbitrary.
- Check the actual food cost percentage at that final price: $5.00 ÷ $16.95 = 29.5%. Close enough to target.
Period example. Now the whole-kitchen version. Opening inventory for the month was $18,000. Purchases during the month totaled $42,000. Closing inventory came in at $16,500. Food sales for the same period were $145,000.
That's within a generally healthy range for a casual full-service concept. If the same math produced a food cost percentage well above the typical range, you'd know something is off, whether that's portion drift, theft, spoilage, or menu items priced too low relative to their actual cost.
Three ways to convert cost to price:
- Factor method: menu price = cost ÷ target food cost %. This is the fastest and most common approach.
- Markup method: menu price = cost × markup multiplier (a 3.3x multiplier roughly targets 30% food cost).
- Minimum selling price: cost ÷ 0.35 gives you the floor price below which you're running an unsustainable margin, even before factoring in labor.
Round up rather than down when the math lands on an awkward number, and always end in .90, .95, or .00 rather than a jarring figure like $16.37. A menu engineering approach that looks at placement and perceived value alongside raw cost math tends to outperform pricing based on formulas alone.
What Is a Good Food Cost Percentage for Your Concept?
Benchmarks vary sharply by concept, and comparing your bakery's numbers to a steakhouse's numbers is a waste of time. Recent aggregated data puts the median at 32.0% for full-service restaurants and 32.4% for limited-service, but the range around those medians is wide.
- Quick-service (QSR): typically 25% to 30%, driven by standardized, high-volume purchasing and simple menus
- Fast casual: usually 28% to 32%
- Casual dining: generally 28% to 33%
- Fine dining: often 30% to 35% or higher, since premium proteins and lower table turns push the ratio up
- Bakery and cafe: wide range, often 25% to 35% depending on how much is made from scratch versus bought finished
- Catering: frequently 25% to 30%, benefiting from bulk purchasing and predictable menus
Food cost percentage never stands alone. It's one half of prime cost, the combined total of food and labor cost, and the number most lenders and coaches actually watch first. A healthy prime cost typically sits between 55% and 65% of sales. If your food cost runs a few points high but your labor is lean, prime cost can still hold steady, and that trade-off is often intentional rather than a problem to fix.
To set a realistic internal target, pull your trailing three months of actual food cost data rather than copying an industry average that doesn't reflect your rent, your labor structure, or your local supplier pricing. A concept with a premium seafood-heavy menu and strong price positioning can run 34% food cost and still be healthy, provided labor and overhead are under control. A budget concept competing on price has far less room to absorb a high number.
Cutting Food Cost Without Cutting Corners
Reducing food cost percentage isn't about buying cheaper ingredients. It's about eliminating the gap between what a dish should cost on paper and what it actually costs once waste, portioning drift, and pricing errors are factored in. Operational practices like receiving checks and portion tests move the needle within weeks, not quarters.
Start with inventory discipline, because you can't fix what you don't measure:
- Check every delivery against the invoice before signing, catching short deliveries and substituted products immediately
- Run weekly cycle counts on high-cost items rather than waiting for a full monthly count
- Rotate stock using FIFO so older product gets used before it spoils
Recipe standardization comes next. A dish that three different cooks make three different ways is a dish with three different food costs. Run periodic portion tests, weighing plated dishes against the standardized recipe, to catch drift before it becomes habitual.
Purchasing tactics offer real leverage too. Consolidating orders with fewer suppliers often earns better pricing than splitting purchases across five vendors chasing the lowest unit price on each item. Renegotiate contracts twice a year, and build seasonal buying into your menu, since produce priced against a seasonal curve moves in the opposite direction of your food cost target if you're locked into a fixed menu built around out-of-season items.
A structured food-waste audit tracking preparation trim, spoilage, and plate waste consistently surfaces cost that never shows up in a standard cost sheet. Many kitchens find 4% to 10% of purchased food never reaches a paying customer.
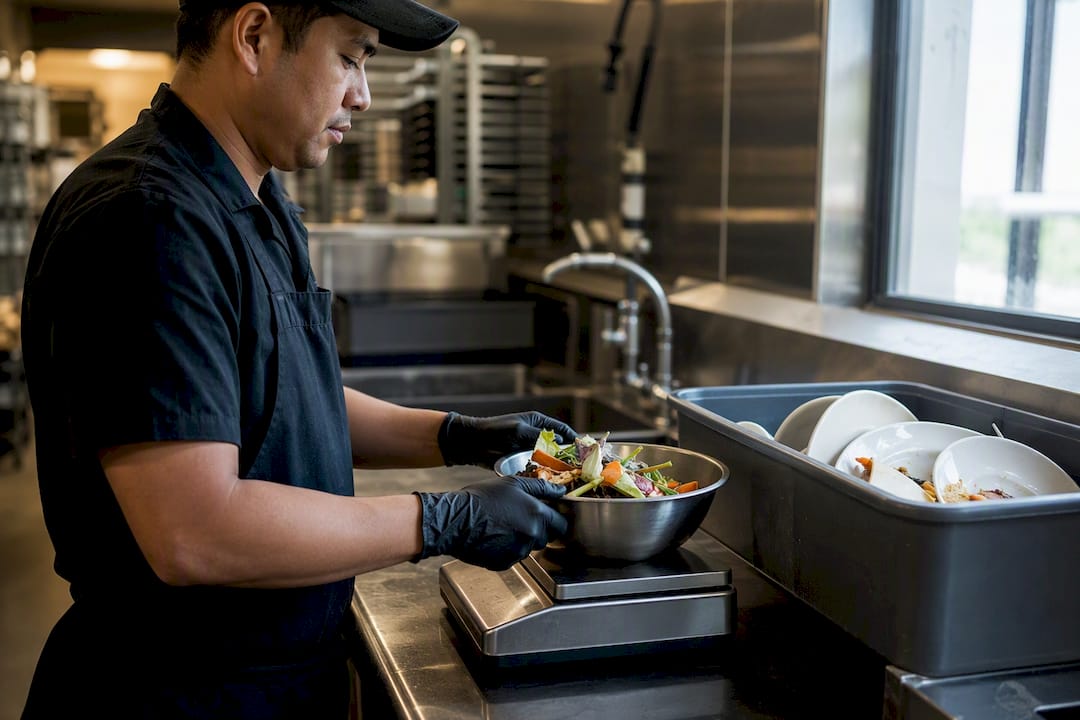
Pro Tip: Track plate waste for one week using nothing more than a kitchen scale and a clipboard by the dish pit. The single highest-waste item on your menu is almost always a surprise, and fixing that one dish often moves your overall percentage more than any supplier renegotiation.
Menu engineering rounds out the list: reprice underperforming high-cost items, move your best-margin dishes to the top-right of the menu where eyes land first, and cut items that consistently sell in single digits per week regardless of their margin. Labor practices interact here too. A dish requiring five prep steps and constant chef attention costs more in labor than its ingredient price suggests, so a full picture of operating costs has to weigh food cost against the labor it demands, not just the ingredients on the plate.
Building Food Cost Into Your Budget and Prime Cost
Food cost percentage means little as an isolated number. It earns its value inside a working budget you actually check every week, not one you build once a year and forget.
Build your budget lines from standardized recipe costs multiplied against your projected sales mix for the period, then anchor the whole thing against your trailing 12 months of actuals rather than a generic industry target. Seasonality matters here: a coastal seafood restaurant's June food cost and its December food cost can differ by several points purely on ingredient pricing.
- Review actual versus budgeted food cost every Monday, not once a month when it's too late to correct
- If the weekly number spikes, run a quick line check and pull the last three supplier invoices before assuming theft or waste
- Compare against your trailing three-month average, not just last year's number, since supplier pricing shifts faster than annual comparisons can catch
Scenario modeling deserves a place in every budget too. If a core protein rises from 28.5% to 33% of its previous cost, model how many additional covers you need to hit the same margin, or how much of that increase you can pass through in price before customers push back. This kind of break-even thinking turns food cost from a static ratio into a live planning tool. Because food cost and labor together make up prime cost, a spike in one often forces a deliberate trade-off in the other, and that's a conversation worth having before the invoice arrives, not after.
The Tools and Weekly Habits That Keep Food Cost Honest
You don't need enterprise software to track food cost well. You need consistent inputs and a habit of checking them.
Recipe-cost calculators, whether standalone tools or built into a POS system, do the heavy lifting on per-dish math instantly once you enter ingredient quantities and current supplier prices. Inventory apps and even a well-built spreadsheet work fine for smaller operations, provided someone actually updates them weekly.
At minimum, track these fields every week:
- Opening stock value at the start of the period
- Total purchases, broken out by category if possible
- Closing stock value from an actual physical count
- Comps, staff meals, and waste, tracked separately from paying food sales
- Total food sales for the same period
A short weekly checklist keeps this from sliding: count high-cost inventory, reconcile invoices against deliveries, pull the period food cost number, compare it to your trailing average, and flag anything more than two points off target for a same-day line check. Broader financial tracking discipline built into your regular bookkeeping routine makes this weekly habit far easier to sustain. Automate the sync between your POS and inventory system once volume makes manual entry unreliable, but keep a human doing the physical count. Software catches math errors. It doesn't catch a case of chicken that walked out the back door.
Why Most Restaurants Get Food Cost Wrong
Most food cost problems I see aren't calculation errors. They're operators chasing a single industry-average number instead of building a target around their own concept, their own supplier contracts, and their own labor structure. Coaching support, particularly specialized guidance for food and beverage operators, tends to help most not with the math but with the discipline of checking it every week and acting on what the numbers actually say.
— Duncan
Get Hands-On Help Lowering Prime Cost
Business coaching gives restaurant owners something a spreadsheet template can't: a coach who checks your numbers against your actual trading week and pushes you to act on what they show before a small drift becomes a real margin problem.

That's the gap between knowing your food cost formula and actually using it to run a tighter kitchen. Coaching support here focuses on three concrete outcomes: getting your food cost percentage moving down faster than trial and error alone would manage, building a weekly tracking habit that actually sticks past the first month, and stress-testing your budget against supplier price spikes before they hit your margin. If you're running a cafe, restaurant, or catering business and want a structured plan instead of another spreadsheet nobody updates, take a look at business coaching built for Australian operators and book a session to walk through where your numbers currently stand.
Sources
- Food cost percentage restaurants — PantryHub
- Free food cost calculator — MarginCub
- How to Create a Restaurant Budget (And Actually Use It) — RestaurantBottomLine