
Margin is profit expressed as a percentage of revenue: take your profit, divide it by revenue, multiply by 100. That single number tells you how much of every dollar you actually keep. The formula you'll use most often is net profit margin = net profit ÷ revenue × 100. If your net profit is $20,000 on $100,000 in revenue, your net margin is 20%. Right now, the most useful thing you can do is pull your last month's figures in Xero or Square, calculate your gross and net margins, and compare them to an industry benchmark. If gross margin is below your target, the problem is almost always pricing or cost of goods. Championbusinesscoaching works with Australian SMEs on exactly this.
- Gross margin: revenue minus cost of goods sold (COGS), divided by revenue
- Net margin: revenue minus all expenses, divided by revenue
- First action: compare both figures to an industry benchmark this month
Table of Contents
- What are the three types of margin you need to track?
- How do you calculate profit margin step by step?
- How does margin differ from markup, and why does it matter?
- What does a good margin look like for Australian SMEs?
- What are the most effective ways to improve your margins?
- How should you monitor margins every month?
- Key Takeaways
- Why margins are the first thing I look at with any Australian SME
- Championbusinesscoaching helps you turn margin data into real decisions
- Useful sources for Australian margin benchmarks and tools
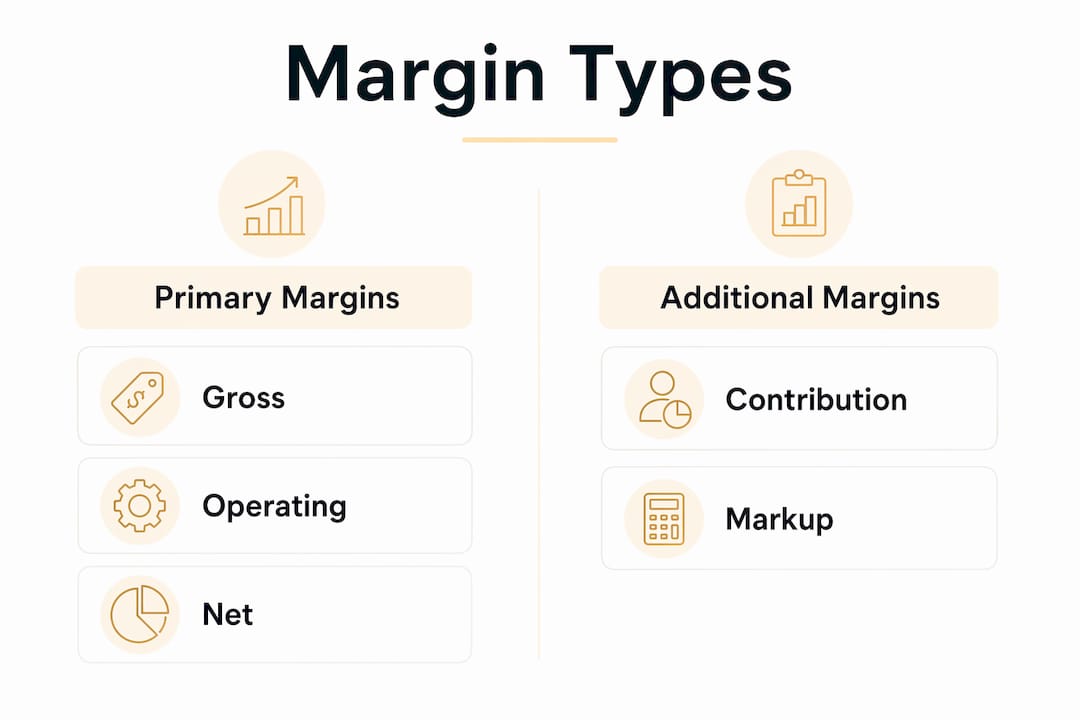
What are the three types of margin you need to track?
Every margin type answers a different question. Use the wrong one and you'll diagnose the wrong problem.
Gross margin measures pricing and product profitability. The formula: (revenue − COGS) ÷ revenue × 100. A café selling coffee with ingredient costs well under sales price carries a high gross margin. That number tells you whether your pricing covers what it costs to make or source what you sell, nothing more.
Operating margin goes one level deeper. It strips out selling, administrative, and overhead costs but leaves out interest and tax: EBIT ÷ revenue × 100. This is the metric that reveals whether your core business operations are genuinely efficient, independent of how you're financed.
Net profit margin is the final verdict after every expense, including interest and tax: (revenue − all expenses) ÷ revenue × 100. A high net margin is a strong signal, but it doesn't automatically mean strong cash flow. Timing differences between paying suppliers and collecting from customers can create cash stress even when the margin looks healthy.
Contribution margin sits outside the three primary types but deserves a mention. It's revenue minus variable costs only, and it's the most useful metric for break-even and project decisions. When you're deciding whether to take on a discounted job or a new client project, contribution margin isolates the incremental benefit of that single sale.
How do you calculate profit margin step by step?
Four steps cover every margin calculation.
- Gather the right revenue and cost lines for the margin type you're calculating.
- Subtract the relevant costs from revenue to get your profit figure.
- Divide that profit figure by revenue.
- Multiply by 100 to convert to a percentage.
Worked example 1: product business
A small Sydney retailer example illustrates margin calculations with revenue, COGS, operating expenses, and tax/interest costs. Gross margin, operating margin, and net margin percentages result from dividing the appropriate profit figure by revenue and multiplying by 100.
Worked example 2: service business
A Brisbane bookkeeper example demonstrates contribution margin and net margin calculations by subtracting variable and fixed costs, tax and interest from revenue, then dividing by revenue and multiplying by 100.

Pro Tip: Service businesses often skip the contribution margin calculation because they have few obvious "goods" costs. Don't. It's the number that tells you whether taking on a low-rate client is worth your time.
Common calculation mistakes
- Mixing margin and markup (using cost as the base instead of revenue)
- Excluding one-off items like equipment purchases or legal fees, which distorts net margin
- Using GST-inclusive revenue instead of ex-GST figures when calculating margins in Australia
- Forgetting owner's salary as an expense in sole-trader or small business accounts
How does margin differ from markup, and why does it matter?
This is the most common pricing error in small business, and it costs real money.
Margin uses revenue as the base: profit ÷ revenue. Markup uses cost as the base: profit ÷ cost. Same dollar profit, different denominators, very different percentages.
Here's the numeric example: you buy a product for $70 and sell it for $100. Your profit is $30.
- Margin: $30 ÷ $100 = 30%
- Markup: $30 ÷ $70 = 42.9%
To convert markup to margin: margin = markup ÷ (1 + markup). To convert margin to markup: markup = margin ÷ (1 − margin).
The practical danger is this: if you set prices by applying a 42.9% markup thinking you're hitting a 42.9% margin target, you're actually landing at 30%. On a $500,000 revenue base, that gap compounds fast. Relying on markup when your target is a margin figure will systematically underprice your offerings and quietly erode profitability over time.
What does a good margin look like for Australian SMEs?
There's no single "good" margin. The right benchmark depends on your industry, business model, and scale.

Broadly, Australian service businesses tend to carry higher margins than product-based ones because COGS is lower. Retail and manufacturing typically run thinner gross margins but can still be healthy if operating costs are controlled. A professional services firm with a high net margin is performing well; a food retailer's net margin tends to be lower but can still be normal for that industry.
Where to check Australian benchmarks:
- Australian Bureau of Statistics (ABS): industry-level financial data for Australian businesses
- Xero benchmarking guides: sector-specific margin data drawn from anonymized Xero user data
- Square AU glossary and reporting tools: useful for hospitality and retail operators
- EEA Advisory: publishes practical Australian margin guidance with industry context for SMEs
Industry, business model, scale, and one-off items all change how you interpret a margin figure. A single-period snapshot is rarely enough. If you want a structured look at where your operations stand, an operations audit can surface the cost and pricing gaps that benchmarks alone won't show.
Pro Tip: Track your margin trend over 6–12 months rather than fixating on a single month's figure. A margin that's consistently improving at 18% tells a better story than one that hit 25% once and has been sliding ever since.
What are the most effective ways to improve your margins?
Margin improvement has a clear priority order. Start with the highest-impact, lowest-effort moves.
0–30 days
- Audit your pricing against current costs. Many Australian SMEs haven't raised prices since 2022 despite significant cost increases.
- Identify your three lowest-margin products or services and decide whether to reprice, restructure, or cut them.
- Calculate contribution margin for each service line. Drop or reprice anything with a contribution margin below your fixed-cost floor.
30–90 days
- Renegotiate supplier contracts. Even a 3–5% reduction in COGS moves gross margin meaningfully.
- Review your sales pipeline for deals that are consuming time without delivering margin. Velocity matters as much as volume.
- Test a small price increase (5–10%) on your highest-demand service before rolling it out broadly. Measure retention over 60 days.
90+ days
- Shift your product or service mix toward higher-margin offerings. This is a structural move that compounds over time.
- Introduce process automation or AI tools to reduce labor costs per unit of output without cutting headcount.
Pro Tip: When communicating a price increase to existing clients, lead with the value you've delivered, not the cost pressure you're facing. Clients who understand the outcome you produce rarely push back on a well-framed increase.
Risks are real: aggressive margin improvement through cost-cutting can damage service quality or staff morale. Pair every cost reduction with a quality check. And remember that high margins enable investment in growth, hiring, and technology, while persistently low margins signal a structural problem that pricing tweaks alone won't fix.
How should you monitor margins every month?
Monthly margin reviews are more effective than annual ones for catching rising COGS or pricing slippage before they compound. Here's a dashboard template you can copy into a spreadsheet or your accounting software.
Monthly margin dashboard
| Field | What to track | Trigger rule |
|---|---|---|
| Revenue | Total ex-GST sales | Drop >5% month-on-month: investigate |
| COGS | Direct product/service costs | Rise >3% without revenue increase: review suppliers |
| Gross margin % | (Revenue − COGS) ÷ Revenue × 100 | Drop >3 percentage points: pricing or COGS issue |
| Operating expenses | Fixed + variable overhead | Rise >2% without revenue growth: cost audit |
| Operating margin % | EBIT ÷ Revenue × 100 | Below industry benchmark: efficiency review |
| Net margin % | Net profit ÷ Revenue × 100 | Below target for 2 consecutive months: full review |
| Contribution margin | Revenue − variable costs | Negative on any line: reprice or cut immediately |
| Cash-flow note | Cash received vs. cash paid | Gap widening: review debtor terms |
The trigger rules matter as much as the fields. A gross margin drop of more than 3 percentage points in a single month is a signal to act, not to wait for the quarter-end report. Pair your margin review with a cash-flow check: net profit margin and cash flow are not the same thing, and a healthy margin with deteriorating cash timing can still threaten the business.
Assign one person (owner or bookkeeper) to run this review on the same day each month. Link the margin KPIs to your cash-flow forecast so you can see the downstream impact of a margin shift before it hits your bank account.
Key Takeaways
Margin is the single most diagnostic number in your business: track gross margin first, use contribution margin for decisions, and never confuse a healthy margin with healthy cash flow.
| Point | Details |
|---|---|
| Define margin correctly | Margin = profit ÷ revenue × 100; markup uses cost as the base and will underprice your offerings. |
| Check gross margin first | Gross margin reveals pricing and COGS health before overhead costs obscure the picture. |
| Use contribution margin for decisions | For discounts, new projects, or break-even analysis, contribution margin isolates the real incremental gain. |
| Benchmark and track monthly | Compare to ABS or Xero sector data, then monitor monthly with trigger rules (e.g., gross margin drop >3%). |
| Championbusinesscoaching | Offers 90-day coaching for Australian SMEs covering pricing strategy, margin analysis, and cash-flow forecasting. |
Why margins are the first thing I look at with any Australian SME
Most business owners I work with know their revenue number cold. Ask them their gross margin and you get a pause. That gap is where profit quietly disappears.
Margins aren't just a reporting figure. They determine whether you can hire, invest in technology, or survive a slow quarter. A business running on thin margins has no buffer for a supplier price increase, a key staff member leaving, or a slow-paying client. The owners who navigate those pressures best are the ones who've built margin awareness into their monthly routine, not their annual tax prep.
The other thing worth saying plainly: a high margin can mask problems too. Under-investment in quality, staff, or systems can inflate short-term margins while eroding the business underneath. Sustainable margins balance what you keep with what you reinvest. That's the conversation worth having, and it's rarely a spreadsheet conversation alone.
For Australian SMEs, the practical starting point is always the same: calculate your gross and net margins this month, find a credible benchmark for your industry, and decide what the gap is telling you. From there, the path to improvement is almost always a combination of pricing discipline, cost structure, and product mix, not a single lever.
Championbusinesscoaching helps you turn margin data into real decisions
Knowing your margin is step one. Knowing what to do about it is where most SME owners get stuck.

Championbusinesscoaching works with Australian small and medium businesses across trades, service businesses, NDIS providers, and food and beverage operators to move from margin awareness to margin improvement. That means working through pricing strategy, contribution margin analysis, cost structure, and monthly dashboard setup in a structured 90-day engagement. Results are guaranteed: if you don't see measurable improvement, your coaching session is free.
The firm also gives clients access to AI-powered tools including cash-flow forecasting and a position description generator, so the work you do in a coaching session connects directly to your operations. Slots are limited to keep the coaching environment focused.
Ready to see where your margins stand? Book a free consultation or review the available coaching plans to find the right fit for your business.
Useful sources for Australian margin benchmarks and tools
- Square AU glossary: clear definitions of gross, operating, and net margin with formula references; useful for hospitality and retail operators.
- Xero margin guides: worked examples and percentage calculations; integrates with Xero's reporting for live margin tracking.
- EEA Advisory: Australia-specific margin guidance with industry context and monthly monitoring advice for SMEs.
- AccountingTools: detailed definitions of contribution margin and its role in break-even and project decisions.
- Australian Bureau of Statistics (ABS): industry-level financial performance data for Australian businesses; use for sector benchmarking.
- Championbusinesscoaching interactive tools: cash-flow forecasting, customer avatar builder, and business improvement resources for Australian SME owners.