
The cash conversion cycle (CCC) measures how many days it takes your business to convert inventory and receivables into cash: CCC = DIO + DSO − DPO. If you run a product-based business, a retail operation, or a manufacturing company, this number tells you more about your working capital health than almost any other single metric. For asset-light service firms, consulting practices, or software companies, it matters far less. According to Investopedia, CCC is derived from balance-sheet and income-statement items and is best interpreted against industry peers and your own trend over time, not as a standalone absolute.
The shorter your CCC, the faster cash cycles back through your business. A shorter CCC means you're freeing up working capital and reducing the time you fund operations from your own pocket before cash returns. Reducing the CCC frees up working capital without the need for additional borrowing.
Key Takeaways
The cash conversion cycle is the single most actionable working-capital metric for inventory-based businesses, and improving it by even 10–15 days can free up meaningful cash without additional borrowing.
| Point | Details |
|---|---|
| CCC formula | CCC = DIO + DSO − DPO; use 12-month averages for all three balance-sheet inputs. |
| Use averages, not snapshots | Year-end figures distort CCC for seasonal businesses; 12-month averages give a reliable trend. |
| Benchmark within your sector | Cross-industry comparisons mislead; compare your CCC to direct peers using their public financials. |
| Three improvement levers | Reduce DIO through forecasting and SKU cuts, shrink DSO with invoice automation, extend DPO through supplier negotiation. |
| Don't over-optimize | Pushing CCC too low through stockouts or stretched payables creates operational fragility, not strength. |
Table of Contents
- What are DIO, DSO, and DPO, and why do they matter?
- How do you calculate the cash conversion cycle step by step?
- How do you interpret your CCC result?
- How can you improve your cash conversion cycle?
- When does the cash conversion cycle mislead you?
- Your 30/60/90-day CCC action plan and spreadsheet template
- The metric most business owners calculate wrong, and what to do instead
- Sources
What are DIO, DSO, and DPO, and why do they matter?
The three components of CCC, as J.P. Morgan's treasury guidance explains, are the operational levers you actually control. Understanding each one tells you exactly where cash is getting stuck.
-
Days Inventory Outstanding (DIO): How long inventory sits on your shelves or in your warehouse before it's sold. High DIO ties up working capital in unsold goods and increases storage and obsolescence risk. Ask yourself: do you hold physical stock? If yes, DIO is your first focus. You'll find inventory on the balance sheet under current assets.
-
Days Sales Outstanding (DSO): How long it takes to collect payment after a sale. A high DSO means you've delivered the product or service but haven't been paid yet. It's the gap between revenue recognized and cash received. Ask: do you sell on credit terms or invoice customers? DSO lives in accounts receivable on the balance sheet.
-
Days Payable Outstanding (DPO): How long you take to pay your own suppliers. A higher DPO is generally favorable because you're holding cash longer before it leaves your account. The catch: push it too far and you damage supplier relationships or lose early-payment discounts. Ask: are your supplier payment terms negotiable? DPO appears in accounts payable on the balance sheet.
Each component pulls CCC in a different direction. Lower DIO and DSO shrink the cycle; higher DPO extends it in your favor. The goal isn't to minimize all three blindly. It's to find the right balance for your business model and sector.
How do you calculate the cash conversion cycle step by step?
The standard formulas from CFI map directly to your financial statements:
- DIO = (Average Inventory ÷ Cost of Goods Sold) × 365
- DSO = (Average Accounts Receivable ÷ Revenue) × 365
- DPO = (Average Accounts Payable ÷ Cost of Goods Sold) × 365
- CCC = DIO + DSO − DPO
Why averages matter more than year-end figures
Using a single year-end balance sheet snapshot is one of the most common calculation errors practitioners see. A retailer with heavy holiday inventory in December will show a distorted DIO if you pull only the December 31 figure. J.P. Morgan's treasury team recommends using 12-month averages for inventory, accounts receivable, and accounts payable to neutralize seasonal spikes and give a reliable trend for decision-making. The averaging method is simple: add the opening and closing balance for the period, then divide by two.
Where to pull each line item
| Input | Financial Statement | Common Account Name |
|---|---|---|
| Inventory (start + end ÷ 2) | Balance sheet | Inventories / Stock on hand |
| Accounts receivable (start + end ÷ 2) | Balance sheet | Trade receivables / AR |
| Accounts payable (start + end ÷ 2) | Balance sheet | Trade payables / AP |
| Cost of goods sold | Income statement | COGS / Cost of sales |
| Revenue | Income statement | Net sales / Total revenue |
Worked example
Suppose a mid-size wholesale distributor reports the following for the fiscal year:
- Average inventory: $800,000
- Average accounts receivable: $600,000
- Average accounts payable: $400,000
- COGS: $4,000,000
- Revenue: $6,000,000
Step 1 — DIO: ($800,000 ÷ $4,000,000) × 365 = 73 days
Step 2 — DSO: ($600,000 ÷ $6,000,000) × 365 = 36.5 days (round to 37 days)
Step 3 — DPO: ($400,000 ÷ $4,000,000) × 365 = 36.5 days (round to 37 days)
Step 4 — CCC: 73 + 37 − 37 = 73 days
That 73-day CCC means this distributor is funding nearly two and a half months of operations before cash returns. Cutting DIO by 15 days through better inventory management alone would bring CCC to 58 days, a meaningful improvement in working capital without touching receivables or payables at all. WallStreetPrep's worked examples confirm that step-by-step calculations like this are the most reliable way for business owners to replicate the metric accurately.
Pro Tip: Build this calculation into a simple spreadsheet with input cells for each balance-sheet figure and a formula row that auto-calculates DIO, DSO, DPO, and CCC. Run it monthly, not just at year-end, so you catch deterioration before it becomes a cash crisis.
How do you interpret your CCC result?
Lower is generally better, but that statement needs context. A CCC of 40 days might be excellent for a food distributor and alarming for a software reseller. GuruFocus notes that CCC is most meaningful for inventory-based businesses and that lower values indicate more efficient working-capital management within a comparable peer group.
What a negative CCC means
A negative CCC means you collect cash from customers before you have to pay your suppliers. Amazon and large grocery chains operate this way: customers pay at checkout, but suppliers get paid 30–60 days later. That gap is essentially free financing. J.P. Morgan's treasury guidance flags the important caveat: a negative CCC can also signal aggressive trade-credit practices that create supplier risk if over-relied upon. It's a sign of bargaining power when it's structural; it's a warning sign when it's manufactured by stretching payables beyond what suppliers will tolerate long-term.
Seasonality and snapshot distortions
Quarter-end and year-end figures can mislead. A toy retailer pulling its CCC in January will show inflated DIO from post-holiday clearance stock. A construction firm calculating DSO in December may show artificially high receivables from a project billing cycle. The fix is consistent averaging across 12 months, as discussed in the calculation section above.
Industry benchmarking
Cross-sector comparisons are nearly meaningless. A grocery chain with a 10-day CCC and a heavy equipment manufacturer with a 90-day CCC are both potentially healthy for their sectors. Investopedia's analysis is direct on this: benchmark against close peers in the same sector, not against a generic "good CCC" number. The right approach is to track your own CCC quarterly over two or more years and compare it against two or three direct competitors using their public financial statements. That trend and peer gap tells you far more than any published benchmark range.
How can you improve your cash conversion cycle?
Improving CCC typically means working three levers: reduce inventory days, accelerate receivables, and extend payables. Investopedia and J.P. Morgan both frame it this way, and each lever has real operational trade-offs you need to manage.
Reducing DIO (inventory days)
- Demand forecasting: Use point-of-sale data and historical trends to order closer to actual demand. Overstocking is the most common DIO inflator.
- SKU rationalization: Cut slow-moving product lines. Every SKU that turns fewer than four times a year is tying up cash.
- Safety-stock optimization: Calculate safety stock based on lead time variability, not gut feel. Most businesses carry 20–30% more safety stock than their actual lead times require.
- Vendor-managed inventory (VMI): For high-volume, predictable SKUs, let the supplier manage replenishment. This shifts inventory risk upstream.
- Watch for: Stockouts. Cutting DIO too aggressively causes lost sales that cost more than the working capital you freed up.
Accelerating DSO (receivables days)
- Tighten credit policy: Review credit limits and payment terms for each customer segment. Net-60 terms for a low-margin customer are rarely worth the cash drag.
- Invoice immediately: Every day between delivery and invoice is a day added to DSO. Automate invoicing through tools like QuickBooks, Xero, or FreshBooks so invoices go out the same day as delivery.
- Early-payment incentives: A 1% discount for payment within 10 days (net 30 terms) is often worth the cost when your cost of capital exceeds 12% annually.
- Automated reminders: Set up AR aging alerts at 15, 30, and 45 days overdue. Most late payments are simply forgotten, not disputed.
- Watch for: Aggressive collection that damages customer relationships. High-value, long-term customers deserve a conversation before a collections call.
Extending DPO (payables days)
- Negotiate terms: Ask suppliers for net-60 or net-90 terms, especially if your volume justifies it. Many suppliers will agree without a formal request.
- Centralize AP: Consolidate payables into a single payment run per week or fortnight. Ad-hoc payments made early are cash leaving your account unnecessarily.
- Dynamic discounting: Some suppliers offer early-payment discounts. Evaluate each one against your cost of capital. If the discount rate exceeds your borrowing rate, take it.
- Watch for: Supplier churn. Pushing DPO beyond what suppliers consider reasonable risks losing preferred pricing, priority allocation, or the relationship entirely.
Priority and timeline
In the first 30 days, focus on data: pull 12-month averages, calculate your baseline CCC, and identify which component is the largest contributor. In days 30–60, target quick wins in DSO (invoice automation, payment reminders) and DIO (SKU rationalization). Changes to DPO and deeper inventory restructuring typically take 60–90 days to negotiate and implement. For trades and product-based businesses, DIO is usually the biggest lever; for businesses with large B2B customer bases, DSO dominates.

Pro Tip: Tie one CCC-related KPI, such as DSO or DIO, to a leadership incentive for the quarter. Metrics that appear on a bonus scorecard get attention that metrics on a dashboard alone rarely do.
For a broader set of cash flow tactics that complement CCC work, the 5 Ways Cashflow Guide from Championbusinesscoaching covers practical levers across the full cash flow picture.
When does the cash conversion cycle mislead you?
CCC is a useful metric, but it has real limits. Knowing when not to use it is as important as knowing how to calculate it.
-
It's derived, not direct. CCC is calculated from balance-sheet and income-statement items, not from your bank account. Wikipedia's entry on the cash conversion cycle notes that it often lags real operational shifts because changes in cash flow don't appear in CCC until they roll through AR, AP, and inventory balances. You can improve operations today and not see it in CCC for 60–90 days.
-
Year-end figures distort results. Using a single balance-sheet date instead of 12-month averages is the most common calculation error. Seasonal businesses are especially vulnerable to this distortion.
-
DPO denominator mismatch. When calculating DPO, some practitioners use "purchases" in the denominator instead of COGS. These produce different results. Wikipedia's CCC entry flags this as a common source of material error. Use COGS consistently across all three formulas for comparability.
-
Limited value for service and asset-light firms. If your business holds no inventory and collects payment upfront or on short terms, CCC tells you almost nothing useful. GuruFocus confirms that CCC is most relevant for inventory-based businesses. For consulting firms, software companies, or subscription businesses, cash flow forecasting, days cash on hand, and the working capital ratio are more informative alternatives. Championbusinesscoaching's service-based business resources address the specific cash metrics that matter for non-inventory firms.
-
Over-optimization creates fragility. J.P. Morgan's treasury team warns explicitly that minimizing CCC at the cost of operations or supplier relationships can damage long-term revenue. A CCC that looks great on paper because you've stripped safety stock to zero and stretched payables to 120 days is a supply-chain disruption waiting to happen.
-
One-off distortions. A large customer paying late in December, a bulk inventory purchase in June, or a supplier dispute that delays payment can all skew a single period's CCC dramatically. Always look at the trend across multiple periods before drawing conclusions.
Your 30/60/90-day CCC action plan and spreadsheet template
Action checklist
- Pull 12-month average balances for inventory, accounts receivable, and accounts payable from your balance sheet.
- Pull COGS and revenue from your income statement for the same period.
- Calculate DIO, DSO, and DPO using the formulas above.
- Calculate CCC and record it as your baseline.
- Identify the largest component (DIO, DSO, or DPO gap) and rank improvement opportunities by impact.
- Find two or three direct competitors with public financials and calculate their CCC for benchmarking.
- Set a target CCC for the next 90 days and assign ownership to finance, purchasing, and sales leads.
30/60/90-day priority plan
| Timeframe | Owner | Action | Target outcome |
|---|---|---|---|
| Days 1–30 | Finance | Pull baseline data, calculate CCC, benchmark peers | Baseline CCC established |
| Days 1–30 | Finance + Sales | Audit AR aging, identify overdue accounts | DSO reduction target set |
| Days 30–60 | Sales / AR team | Automate invoicing, launch early-payment incentives | DSO reduced by 5–10 days |
| Days 30–60 | Purchasing | Rationalize slow-moving SKUs, review safety stock | DIO reduced by 5–10 days |
| Days 60–90 | Purchasing / Finance | Negotiate extended supplier terms | DPO extended by 5–15 days |
| Days 60–90 | Finance | Recalculate CCC, compare to baseline and peer benchmark | Quantified improvement confirmed |
Spreadsheet template layout
Copy these columns into Excel or Google Sheets. Use rows for each period (monthly or quarterly).
| Column | Input or Formula |
|---|---|
| Period | Label (e.g., Q1) |
| Avg Inventory ($) | Input |
| Avg Accounts Receivable ($) | Input |
| Avg Accounts Payable ($) | Input |
| COGS ($) | Input |
| Revenue ($) | Input |
| DIO (days) | =(Avg Inventory / COGS) × 365 |
| DSO (days) | =(Avg AR / Revenue) × 365 |
| DPO (days) | =(Avg AP / COGS) × 365 |
| CCC (days) | =DIO + DSO − DPO |
Add a validation check: flag any period where CCC increases by more than 10 days quarter-over-quarter. That's your early-warning trigger to investigate before a cash shortfall develops. For broader business improvement frameworks that complement this kind of structured financial tracking, Championbusinesscoaching's blog covers operational efficiency across multiple business types.
The metric most business owners calculate wrong, and what to do instead
Most articles on CCC treat it as a finance exercise. Pull the numbers, run the formula, done. What I've seen working with business owners across product-based and trade sectors is that the calculation is rarely the problem. The problem is that owners calculate CCC once, file the result, and never look at it again.
CCC is a trend metric. A single data point tells you almost nothing. Three or four quarters of data tells you whether your working capital is tightening or loosening, and more importantly, which component is driving the change. When DSO creeps up by 8 days over two quarters, that's a credit policy or invoicing problem you can fix. When DIO spikes in Q3, that's a purchasing or demand-forecasting problem. The number points you to the right conversation.
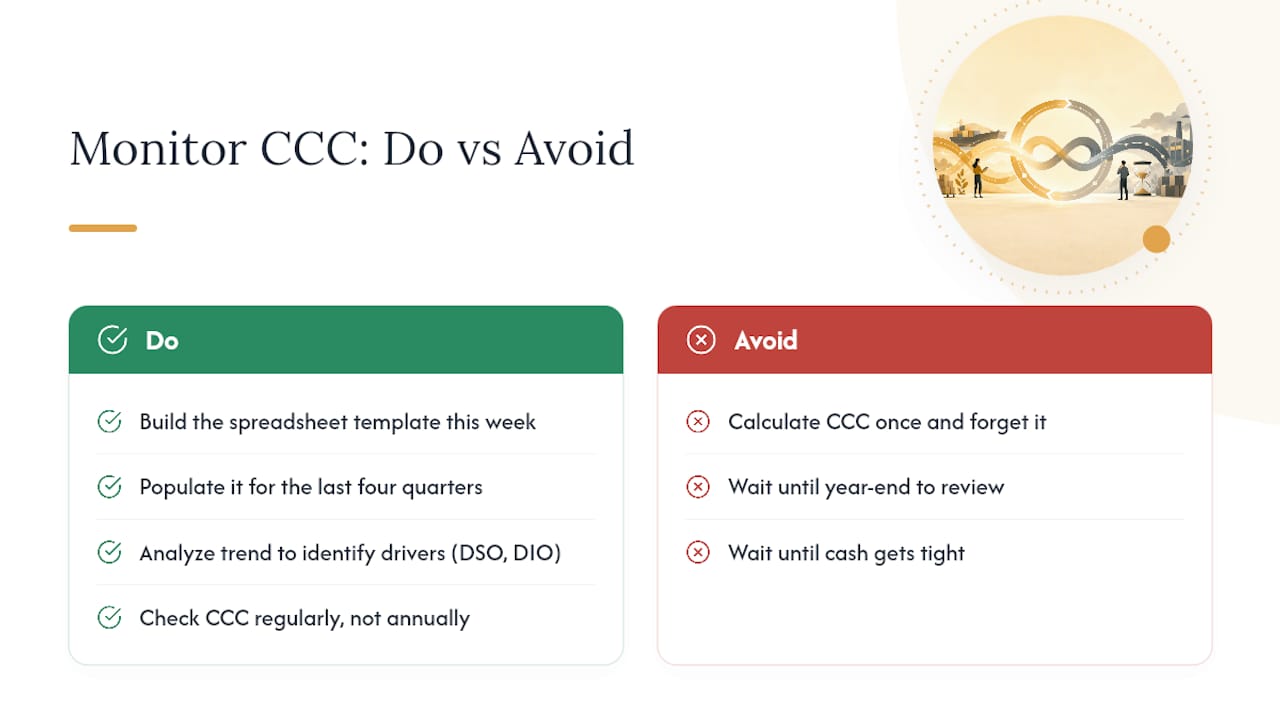
The most practical thing you can do this week is build the spreadsheet template from the section above, populate it for the last four quarters, and look at the trend. Don't wait for year-end. Don't wait until cash gets tight. The businesses that manage CCC well treat it the same way they treat their bank balance: something they check regularly, not annually.
If you want structured support running a 90-day CCC improvement program, with weekly checkpoints and clear ownership across your finance, purchasing, and sales teams, Championbusinesscoaching's coaching programs are built around exactly this kind of operational and financial focus. The coaching plans page outlines what a structured engagement looks like, including the 90-day guarantee.
This article is general information, not a substitute for advice from a qualified financial advisor. Consult a qualified financial professional about your own circumstances before acting on anything here.
Sources
- Understanding & Optimizing Your Cash Conversion Cycle (CCC)
- Cash Conversion Cycle (Investopedia)
- Cash Conversion Cycle (GuruFocus)
- Cash Conversion Cycle (WallStreetPrep)
- Cash conversion cycle (Wikipedia)