
The break-even point tells you exactly how much you need to sell before your business stops losing money. There are two formulas, and you need both.
BEP (units) = Fixed costs ÷ (Selling price per unit − Variable cost per unit)
BEP (revenue) = Fixed costs ÷ Contribution margin ratio
The contribution margin ratio is simply (Price − Variable cost) ÷ Price.
Quick example: a business with $10,000 in monthly fixed costs, a $100 selling price, and $20 in variable cost per unit has a contribution margin of $80 and a ratio of 0.80. That gives a BEP of 125 units or $12,500 in revenue. Sell less than that, and you're running at a loss. Sell more, and every unit above 125 contributes $80 straight to profit.
Key Takeaways
The most reliable way to use break-even analysis is to run it with accurate, period-matched inputs, compute both the units and revenue figures, and test at least two what-if scenarios before making any pricing or cost decision.
| Point | Details |
|---|---|
| Two formulas, one concept | BEP (units) = Fixed costs ÷ Contribution margin; BEP (revenue) = Fixed costs ÷ CMR. Both are algebraically equivalent. |
| Input accuracy is everything | Misclassified costs or mismatched time periods (monthly vs. annual) will produce a BEP that misleads rather than guides. |
| Margin of safety matters | Calculate (Actual sales − BEP sales) ÷ Actual sales; a low result signals real financial risk. |
| Run what-if scenarios | Test a 10% price increase, a 5% variable cost cut, and a sales-mix shift before finalizing any pricing or operational decision. |
| Championbusinesscoaching | Coaches use BEP alongside cash flow forecasts to turn break-even numbers into concrete pricing and operational decisions for Australian businesses. |
Table of Contents
- What is the breakeven analysis formula and why does it matter?
- The two core break-even formulas and how contribution margin connects them
- How to identify fixed costs, variable costs, and semi-variable items
- Step-by-step break-even calculation with a worked Australian example
- How to calculate break-even when you sell multiple products
- How to calculate break-even in Excel using Goal Seek
- What break-even analysis doesn't tell you — and how to stress-test it
- Research-backed tips: treat break-even as a living decision tool
- Break-even analysis in small Australian businesses: when it helps and when it misleads
- How Championbusinesscoaching turns your BEP numbers into real decisions
- Sources
What is the breakeven analysis formula and why does it matter?
The break-even point is the exact sales level where total revenue equals total costs — no profit, no loss. Cross it and you're profitable. Fall short and you're subsidizing operations from reserves or debt.
Three situations where running this calculation pays off immediately:
- Pricing decisions: If raising your price by $10 drops your BEP from 200 units to 140, that's a meaningful shift in risk.
- Viability checks: Before launching a product or service, BEP tells you whether the required sales volume is realistic given your market.
- Loan or investment readiness: Lenders and investors want to see that you understand your cost structure and the sales volume needed to service debt.
Pro Tip: Hitting your BEP is not the same as financial comfort. The margin of safety — the gap between your actual sales and your BEP — is what gives you breathing room. A business running at exactly BEP has zero buffer against a slow month.
Tools like Xero (AU) and Microsoft Excel's Goal Seek function make it straightforward to track the inputs and run the calculation. The U.S. Small Business Administration defines contribution margin as the portion of revenue that covers fixed costs after variable costs are paid — a clean way to think about what each sale actually does for your bottom line.
The two core break-even formulas and how contribution margin connects them
Both formulas rest on the same concept: contribution margin. Understanding that relationship makes the math intuitive rather than mechanical.
Contribution margin (per unit) = Selling price per unit − Variable cost per unit
Contribution margin ratio (CMR) = Contribution margin per unit ÷ Selling price per unit
From there, the two BEP formulas follow directly:
| Formula | Inputs required | Output | Best used when |
|---|---|---|---|
| Fixed costs ÷ (Price − Variable cost) | Fixed costs, unit price, variable cost per unit | Units to break even | You sell a defined product with a clear per-unit cost |
| Fixed costs ÷ Contribution margin ratio | Fixed costs, CMR | Revenue to break even | You run a service business or mixed-product operation without clean per-unit data |
The two formulas are algebraically equivalent. Multiply BEP in units by the selling price and you get BEP in revenue. The revenue formula is simply the more practical choice when per-unit data is hard to isolate — a common situation for Australian service businesses, trades, or food and beverage operators.
Yale School of Management notes that the underlying math is straightforward, but careful handling of inputs and units is where most errors occur. The formula is only as good as the numbers you feed it.
Key points on contribution margin:
- A higher contribution margin ratio means each dollar of revenue covers more fixed cost.
- A CMR below 0.30 (30%) signals a cost-heavy model that requires high volume to break even.
- Improving your CMR — by raising price or cutting variable costs — lowers your BEP without touching fixed costs.
For a deeper look at how margin definitions connect to BEP, that distinction between gross margin and contribution margin matters more than most owners realize.
How to identify fixed costs, variable costs, and semi-variable items
Getting the formula right is the easy part. Getting the inputs right is where most BEP calculations go wrong.
Typical fixed costs (stay constant regardless of sales volume):
- Rent and occupancy costs
- Base salaries and superannuation
- Insurance premiums
- Loan interest and lease payments
- Software subscriptions and annual licenses
Typical variable costs (scale directly with each unit sold or each job completed):
- Raw materials and stock
- Direct labor paid per job or per unit
- Payment processing fees (e.g., Square AU charges per transaction)
- Packaging and shipping costs
- Sales commissions
Semi-variable costs are the tricky ones. Power bills, phone plans, and vehicle costs all have a fixed base component plus a usage-driven variable portion. The practical approach: look at your lowest-activity month to isolate the fixed floor, then treat the remainder as variable. For example, if your electricity bill ranges from $400 to $700 depending on production volume, treat $400 as fixed and allocate the rest as a per-unit variable cost.
A rough BEP beats no BEP.*
One more thing that trips up a lot of business owners: time-period mismatch. If your fixed costs are annual figures but your sales data is monthly, your BEP will be off by a factor of 12. Pick one period — monthly is usually more useful for cash planning — and convert every input to match before you run the calculation.
Step-by-step break-even calculation with a worked Australian example
Follow these steps in order and you'll have both BEP outputs in under ten minutes.
- Gather your inputs: total fixed costs for the period, selling price per unit (or average transaction value), and variable cost per unit (or as a percentage of revenue).
- Calculate contribution margin: Price − Variable cost per unit.
- Calculate contribution margin ratio: Contribution margin ÷ Price.
- Compute BEP in units: Fixed costs ÷ Contribution margin.
- Compute BEP in revenue: Fixed costs ÷ Contribution margin ratio.
- Sanity check: Multiply BEP units by your selling price. The result should match your BEP revenue figure.
Worked example — a Gold Coast trade business:
This business needs to complete about 34 jobs per month or generate a revenue figure in the low $13,000 range before it earns a single dollar of profit. At 30 working days, that's slightly more than one job per day. Realistic? That's the question the owner now has a concrete number to answer.
Wall Street Prep demonstrates this same calculation pattern and confirms that manual BEP and Excel Goal Seek produce identical outputs when inputs are consistent.
On time periods: if you prefer an annual view, multiply monthly fixed costs by 12 and keep price and variable cost per unit unchanged. The BEP in units will scale proportionally. Monthly figures are generally more useful for cash flow planning because they align with how bills actually arrive.
How to calculate break-even when you sell multiple products
A single-product BEP is clean. Most businesses aren't that simple.
When your sales mix includes multiple products or services at different prices and margins, you need a weighted average contribution margin before you can compute a combined BEP.
Weighted average CM = Sum of (CM per product × that product's share of total unit sales)
Short example: a Brisbane café sells two items — coffee at $5 (variable cost $1.50, CM $3.50) and a meal at $18 (variable cost $8, CM $10).
(0.70 × $3.50) + (0.30 × $10.00) = $2.45 + $3.00 = $5.45
With $6,000 in monthly fixed costs, BEP = $6,000 ÷ $5.45 = 1,101 units (combined coffee and meals).
Why this matters: if that café shifts its mix toward more meals and fewer coffees, the weighted CM rises and the BEP in units falls. The reverse is also true. A sales-mix shift of 10 percentage points can move your BEP by hundreds of units without any change in price or cost. Re-run the calculation whenever your product mix changes materially — at minimum, quarterly.
How to calculate break-even in Excel using Goal Seek
Excel's Goal Seek function solves BEP automatically, which is useful when your model has multiple variables or you want to test a profit target other than zero.
Simple spreadsheet layout:
- Inputs block (rows 1–5): Fixed costs, selling price, variable cost per unit, units sold (this is your changing variable).
- Calculations block (rows 7–10): Revenue (= units × price), total variable costs (= units × variable cost), total costs (= fixed + variable), profit (= revenue − total costs).
- Output block (row 12): BEP units (= fixed costs ÷ contribution margin) as a check figure.
Goal Seek steps:
- Go to Data → What-If Analysis → Goal Seek.
- Set "Set cell" to your profit cell (e.g., B10).
- Set "To value" to 0.
- Set "By changing cell" to your units-sold cell (e.g., B5).
- Click OK. Excel will return the exact unit count that produces zero profit.
Stripe documents this Goal Seek approach as a practical method for solving BEP in spreadsheet models, particularly when the model includes non-linear cost structures.
Pro Tip: Use Goal Seek for what-if scenarios too — set "To value" to your target profit (e.g., $5,000) instead of zero to find the sales volume needed to hit a specific margin, not just break even.
For Australian businesses, Xero (AU) and Square (AU) are the most practical sources for the actual input data. Xero gives you accurate fixed-cost totals from your chart of accounts. Square's transaction reports give you average revenue per sale and can help you estimate variable costs as a percentage of sales. Feeding real numbers from these tools into your Excel model is far more reliable than estimating from memory.
What break-even analysis doesn't tell you — and how to stress-test it
BEP is built on assumptions. When those assumptions break down, the number misleads you.
Core assumptions to watch:
- Price stays constant across all units sold (no discounting, no tiered pricing).
- Variable cost per unit stays constant regardless of volume (no bulk discounts, no overtime rates).
- Costs behave linearly — fixed costs don't jump at higher volumes (no new equipment, no extra staff).
- You sell a single product, or your sales mix stays fixed.
Margin of safety is the practical antidote to over-relying on BEP:
Margin of safety is calculated as (Actual or projected sales minus break-even sales) divided by Actual or projected sales, expressed as a percentage. For example, if projected monthly revenue is moderately above the break-even point, this indicates a healthy margin of safety allowing for some sales fluctuation before losses occur.
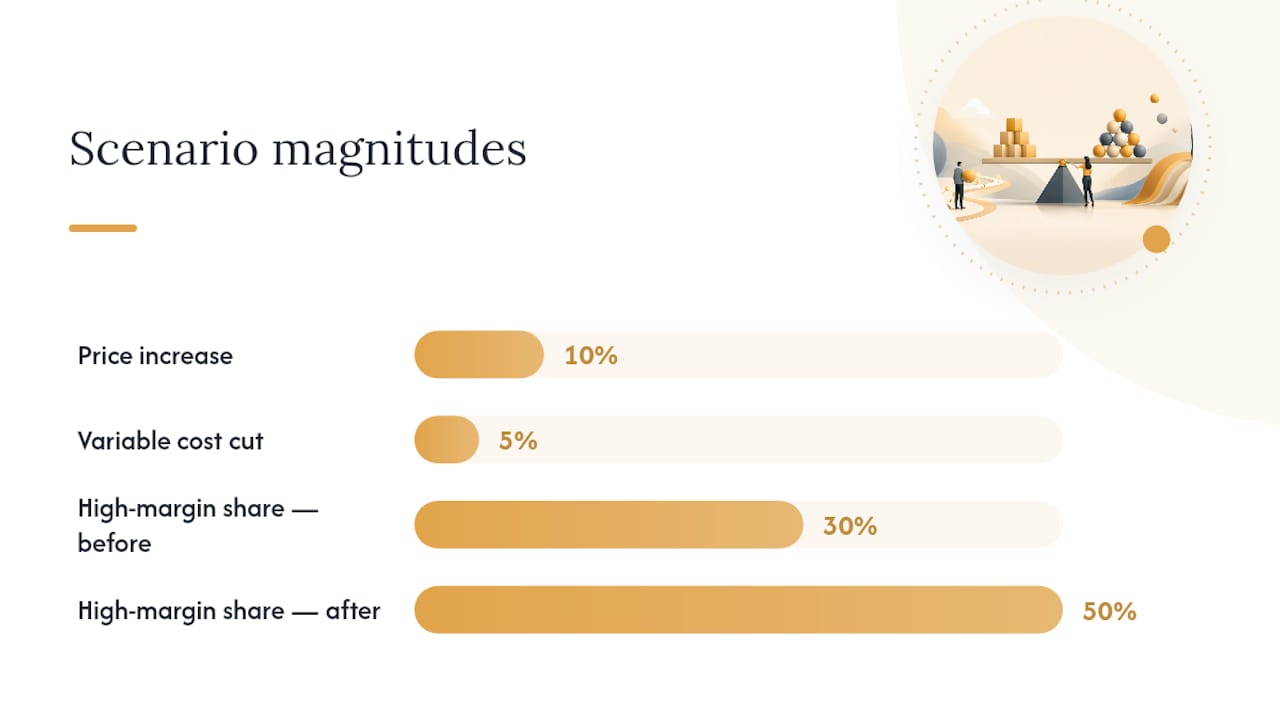
Three scenario tests worth running every time:
- Price increase of 10%: recalculate contribution margin and BEP. How many fewer units do you need to sell?
- Variable cost reduction of 5%: same exercise. Does it move the needle enough to justify the effort?
- Sales-mix shift: if your highest-margin product grows to 50% of sales from 30%, what happens to your weighted average CM and BEP?
NetSuite recommends treating break-even analysis as a dynamic tool for testing pricing and cost-reduction scenarios before implementing them — not a single number you calculate once and file away. Running two or three what-if scenarios takes less than 30 minutes in Excel and can prevent a pricing decision that looks profitable on paper but isn't.
For practical steps on turning BEP results into business improvement strategies, the operational follow-through matters as much as the calculation itself.
Research-backed tips: treat break-even as a living decision tool
The arithmetic is simple. The discipline of using it well is not.
Yale SOM's guidance makes the point plainly: the value of BEP analysis comes from careful input choice and scenario analysis. Computing a single BEP number and treating it as fixed is the most common way to make a brittle decision.
A practical checklist coaches use with clients:
- Verify every cost is correctly classified as fixed or variable before computing.
- Confirm all inputs use the same time period (monthly or annual — never mixed).
- Build a margin-of-safety target into the plan, not just the BEP itself.
- Re-run the calculation monthly, or immediately after any significant cost or price change.
- Flag any assumption that is likely to break — especially volume-dependent cost jumps.
Those are the situations where a misclassified cost or a wrong assumption has real financial consequences.
Pro Tip: Pair your BEP with a cash flow forecast — BEP tells you the volume you need, but cash flow tells you whether you can survive long enough to get there. Both tools together give you a complete picture.
Break-even analysis in small Australian businesses: when it helps and when it misleads
BEP is one of the first numbers coaches review with clients, and it's often the one that reframes a conversation fastest.
That said, Australian businesses carry costs that complicate a clean BEP calculation. GST affects your effective revenue figure if you're not careful to use GST-exclusive prices in the formula. Payroll tax thresholds vary by state and can create a step-change in fixed costs at certain wage levels — a non-linear jump the standard BEP formula doesn't capture. Seasonal businesses, common in tourism, hospitality, and construction, need a BEP that reflects their actual trading months rather than an annual average spread evenly across 12.
The practical fix: run BEP on your peak trading period and your slowest period separately. If you can't break even in your slowest month even with reduced fixed costs, that's a cash reserve problem, not just a BEP problem.
Old numbers are worse than no numbers. A BEP calculated on last year's rent and wages is already wrong if either has changed. Treat it as a living document, not a one-time exercise.
How Championbusinesscoaching turns your BEP numbers into real decisions
Knowing your break-even point is the start. Knowing what to do with it — how to adjust pricing, restructure costs, or sequence a product launch — is where most owners get stuck.

Championbusinesscoaching works with Australian business owners to move from calculation to action: running scenario tests on your actual numbers, identifying which cost levers move your BEP the most, and building a margin-of-safety buffer into your operating plan. The 90-day coaching guarantee means you get results or the session is free.
Before a consultation, pull together: your most recent P&L or a simple list of fixed and variable costs, your current pricing, your average monthly sales volume, and a target profit margin. That's enough to run a full BEP and scenario analysis in the first session.
Ready to put your numbers to work? Book a free consultation or explore the coaching plans to find the right fit.
Sources
These are the sources worth bookmarking after you've run your first BEP calculation.
- What Is Break-Even Analysis: Formula and Guide | NetSuite
- A Primer on Breakeven Analysis | Yale School of Management
- How to calculate the break-even point | Stripe
- Break-even point | U.S. Small Business Administration
- Break Even Point (BEP) | Formula + Calculator
This article is general information, not a substitute for advice from a qualified financial advisor. Consult a qualified financial professional about your own circumstances before acting on anything here.